July brought some special events to computing history. IBM announced the Model 650 Computer in 1953. In 1968 Intel was officially founded – and since, IBM has been using Intel chips in their personal computers. Computing history would be much different, and probably a lot less useful without chips from Intel or influence from IBM. Fun fact: Gordon Moore, one of the founders of Intel is responsible for Moore’s Law.

.NET news
- The .NET Foundation has opened nominations for its chair committee
- F# 5 and F# tools update for June
- Announcing .NET 5.0 Preview 6
- Announcing Entity Framework Core EFCore 5.0 Preview 6
- Blazor WebAssembly Template Lands in .NET 5 Preview 6
- Introducing dotnet-monitor, an experimental tool
- .NET Conf “Focus on Microservices”
.NET tutorials and tips
What is Entity Framework in ASP.NET MVC – Asma Khalid demonstrates the what and how of ASP.NET MVC.
Visualizing ASP.NET Core endpoints using GraphvizOnline and the DOT language – This is an excellent and quite useful post by Andrew Lock showing how to visualize ASP.NET Core endpoints.
Learn how you manage routing in Blazor for .NET Core and VS Code – Check out this nice post by Chris Noring, showing you how to manage routing in Blazor.
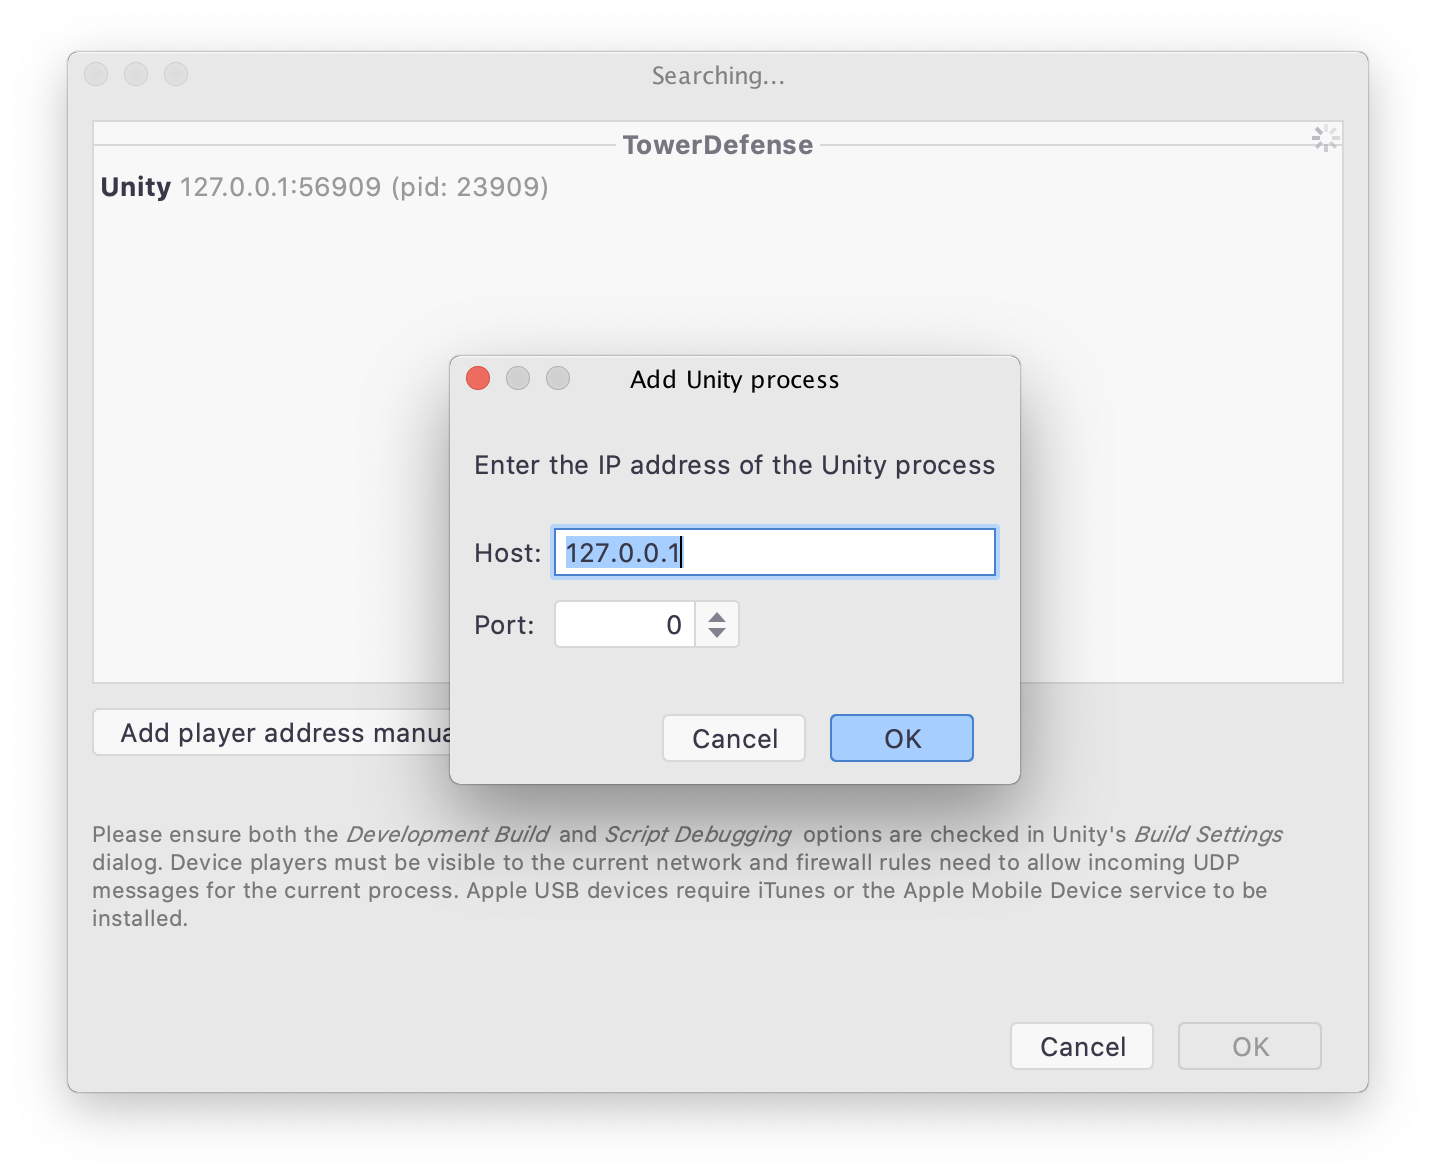
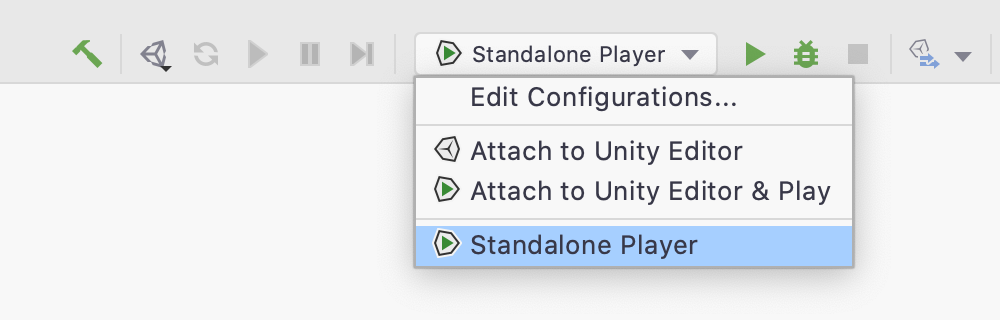
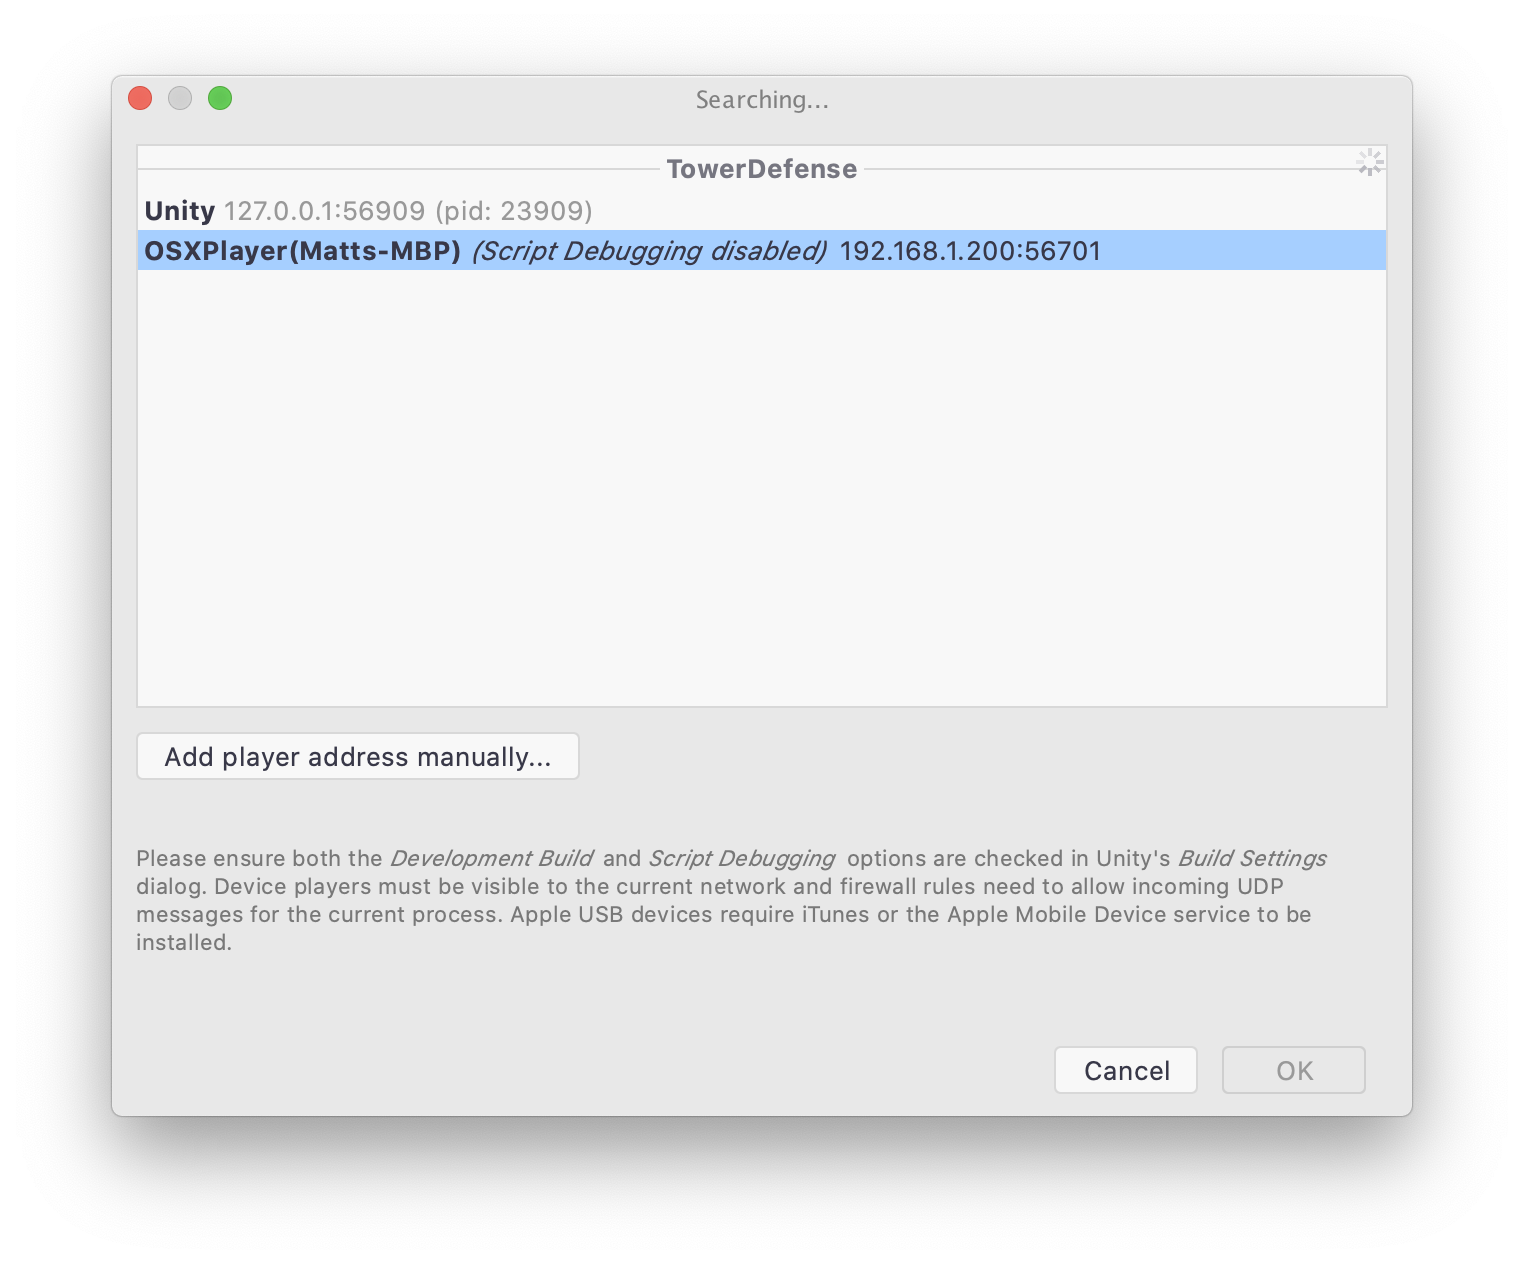
Remote debugging Windows containers with Rider – Joost Meijles dives into debugging Windows containers, with Rider!
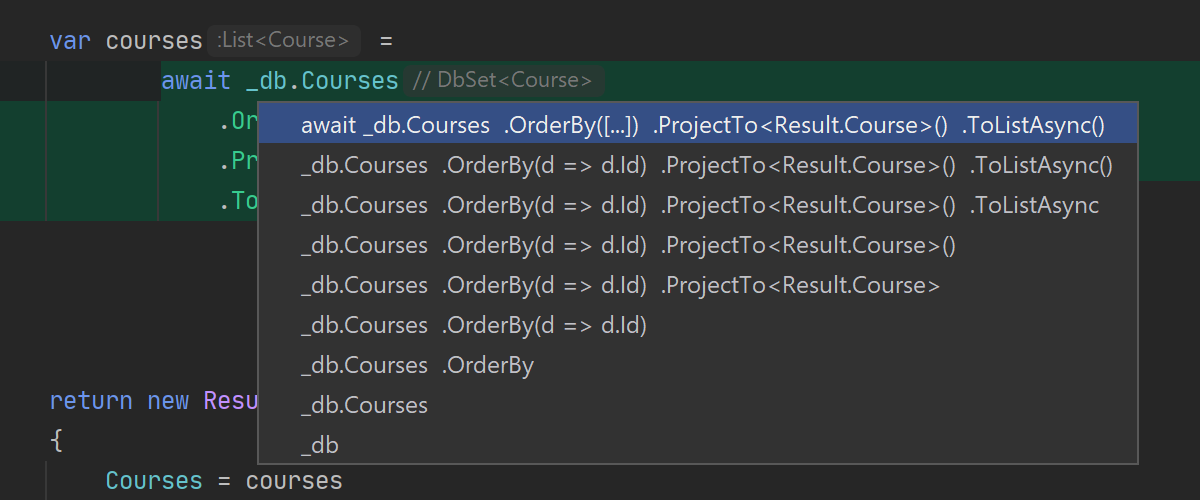
Dynamically Build LINQ Expressions – Jeremy Likness’ post on dynamically building LINQ Expressions will prove to be quite useful. It’s the kind of thing that many developers need to do, but have difficulty implementing.
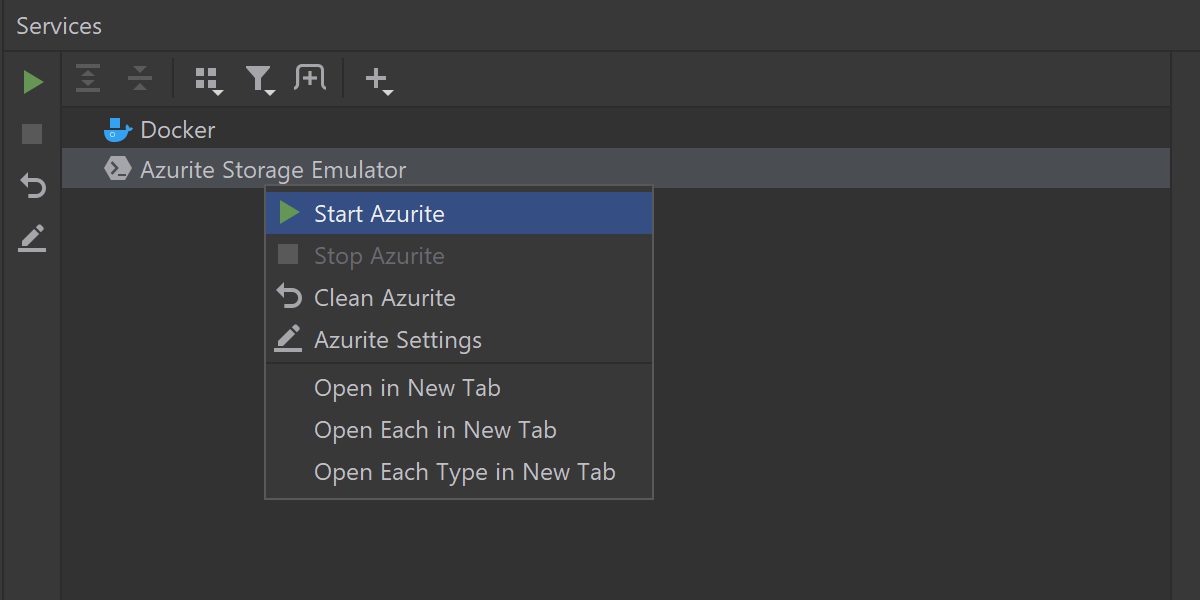
Run Azurite in Docker with Rider and keep Azure Storage data local to a solution – Have you seen Azurite yet? How about running it in Docker? Let Maarten Balliauw show you!
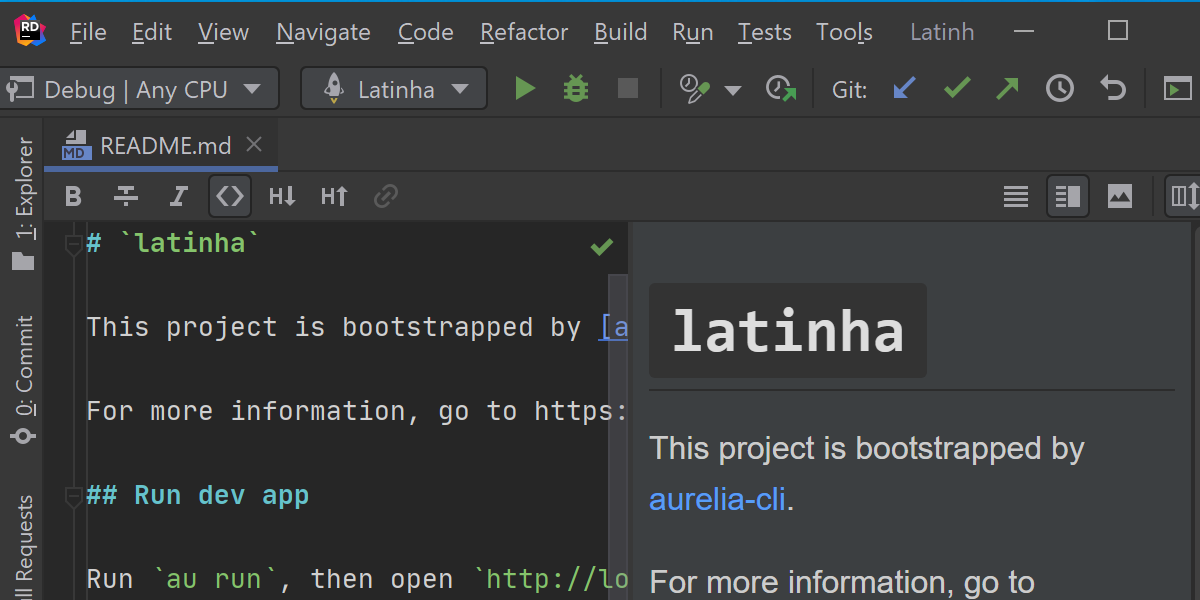
Parse Markdown Front Matter With C# – Markdown! It’s a favorite way to whip up docs quickly. So this post by Khalid Abuhakmeh details how to parse it in C#.
Elastic Jobs in Azure SQL Database (2 Part series) – SQL is an important part of .NET development. Start with Part 1 by Anna Hoffman & Marisa Brasile and learn everything you need to know about Elastic Jobs in Azure SQL Databases.
On simplifying null validation with C# 9 – Everyone wants to make things like null check simpler. This post by Dave Brock shows you how.
5 useful Xamarin Forms Snippets – They are useful! Check out these Xamarin Forms snippets by Damien Doumer.
ASP.NET Core MVC API: How to Perform a Partial Update using HTTP PATCH Verb – This is valuable information for those times when you need to do something different, such as a partial update in a CRUD app. David Grace gives us the knowledge to get that done in this post.
Deploying ASP.NET Core Web Applications to Docker – Shipping is a feature! Bjoern Meyer writes about how to do it with Docker.
It’s all in the Host Class: Dependency Injection with .NET (Part 1) and Configuration (Part 2) – Christian Nagel reveals everything you need to know in this 2 Part series about the Host Class in .NET.
3+1 ways to manage state in your Blazor application – We strive for stateless apps but we also need to store data for each session. John Hilton shows us how to manage it in Blazor.
XML + JSON Output for Web APIs in ASP .NET Core 3.1 – Shahed Chowdhuri strikes again, with this excellent post on XML + JSON output for Web APIs.
Unraveling the Azure Maya Mystery and building a world – Ok, it’s not .NET per se, but Jen Looper has created this fun Azure Maya Mystery using Azure and Vue.JS. It’s great so check it out!
Integration of Azure Data Explorer with Cosmos DB for near real-time analytics – Azure Data Explorer and CosmosDB are now important facets if .NET development in the cloud. Let Minni Walia show you how to run near real-time analytics for it.
Events, community and culture
Struggling To Focus? How To Be Accountable While Working Remotely – Emily Whitten demonstrates how to do remote work well.
Dismantling barriers to participation in programming communities with Dr. Denae Ford – The software development industry has long been plagued by gatekeeping and unwelcoming communities. In this podcast, Scott Hanselman talks to Dr. Denae Ford about how to involve more folks by dismantling the barriers.
Does A 4-Day Workweek Actually Increase Productivity? – Well, does it? Microsoft Japan and other companies are trying it. In this blog post, Suzanne Zuppello has some thoughts about it. What do you think?
Random interesting and cool stuff
Contribute To The Top 10 Impactful .NET OSS Projects 2020 – Folks are always looking for OSS projects. Whether you’re new to OSS or an OSS pro, here are the top 10 impactful projects you might consider contributing to.
The ASP.NET Monsters [Dave Paquette, Simon Timms, James Chambers] .NET podcast. – These guys are fun and knowledgeable, and it’s definitely worth it to listen to their podcast.
And finally…
Here’s a chance to catch up on JetBrains news that you might have missed:
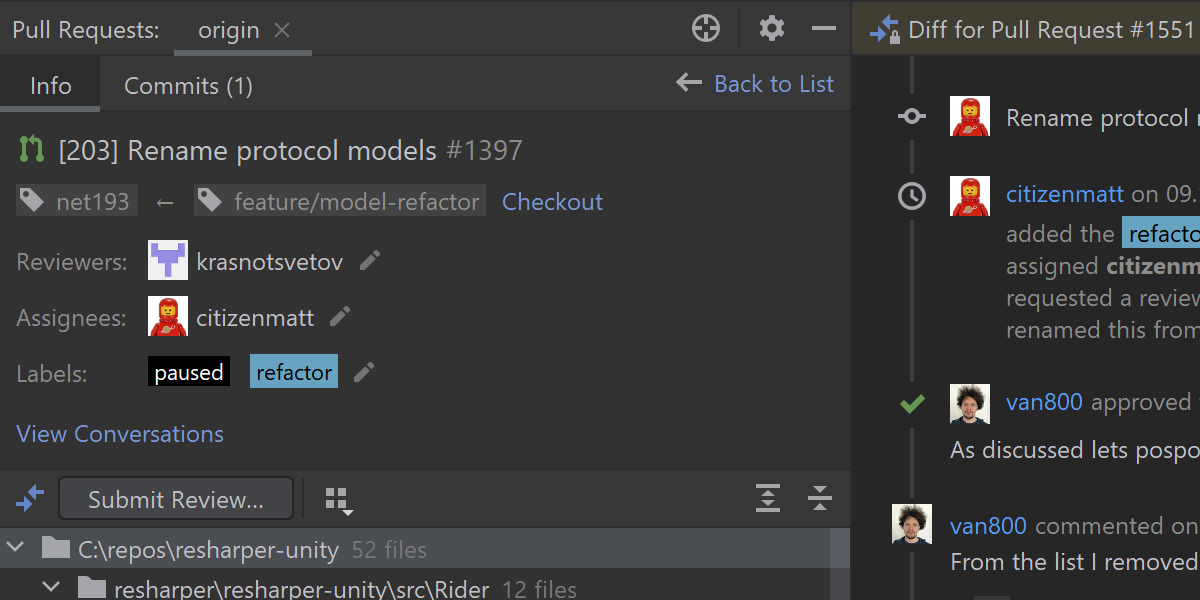
- Rider 2020.2 Early Access Program Begins!
- ReSharper Ultimate Starts Its Early Access Program for 2020.2!
- The Developer Ecosystem in 2020: Key Trends for C#
- Advocates on Rider – Uncovering the IDE That Gets You Places – Webinar Recording
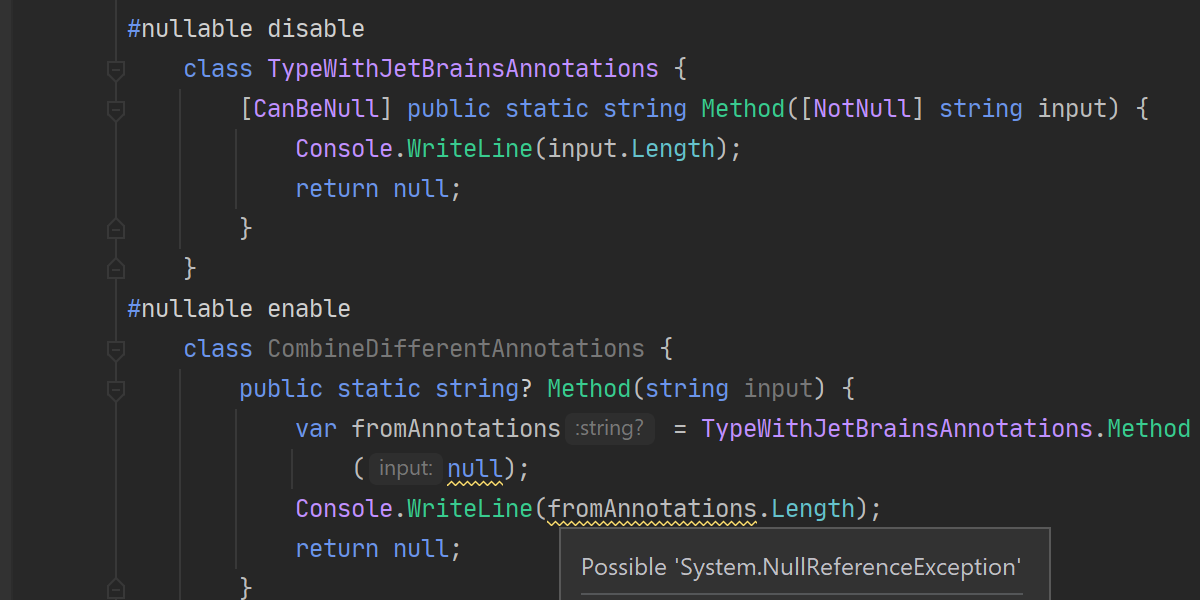
- Webinar – How to stop worrying and adopt nullable reference types
- A Guide To Migrating From ASP.NET MVC to Razor Pages
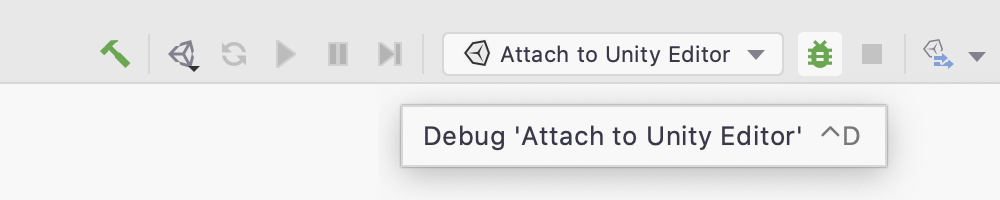
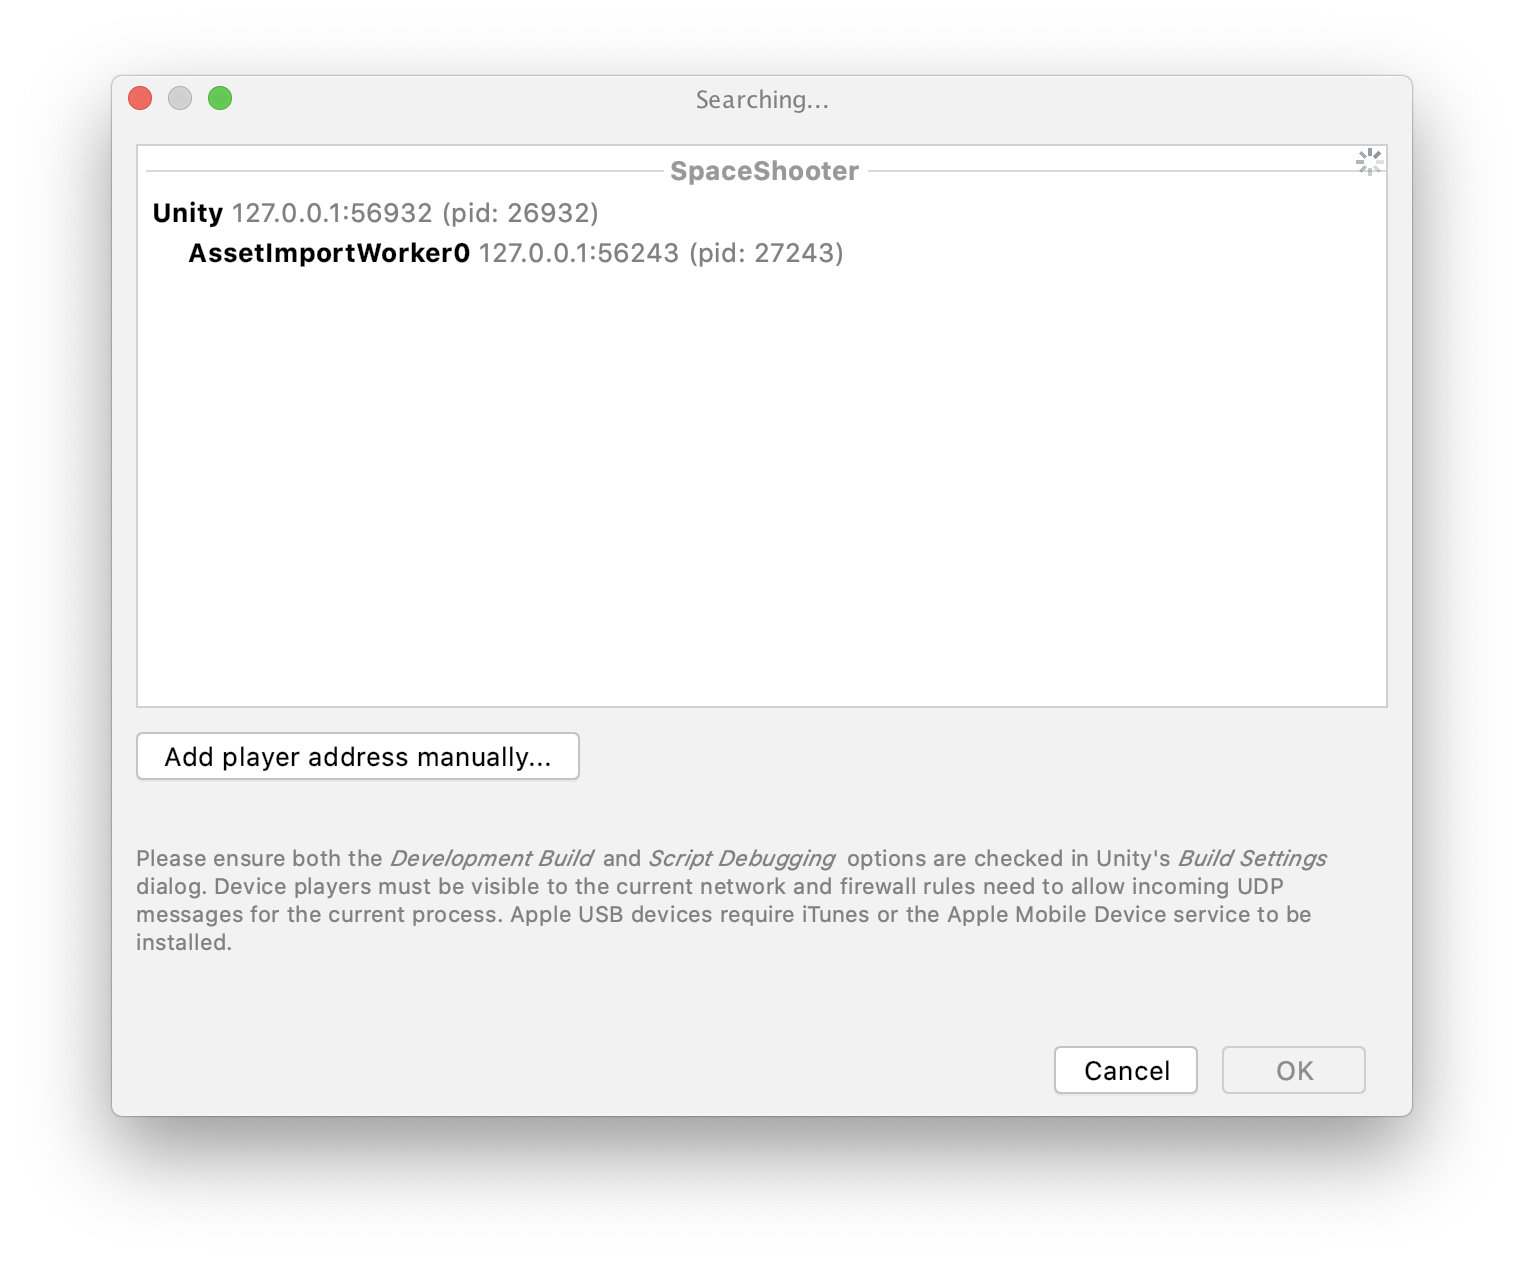
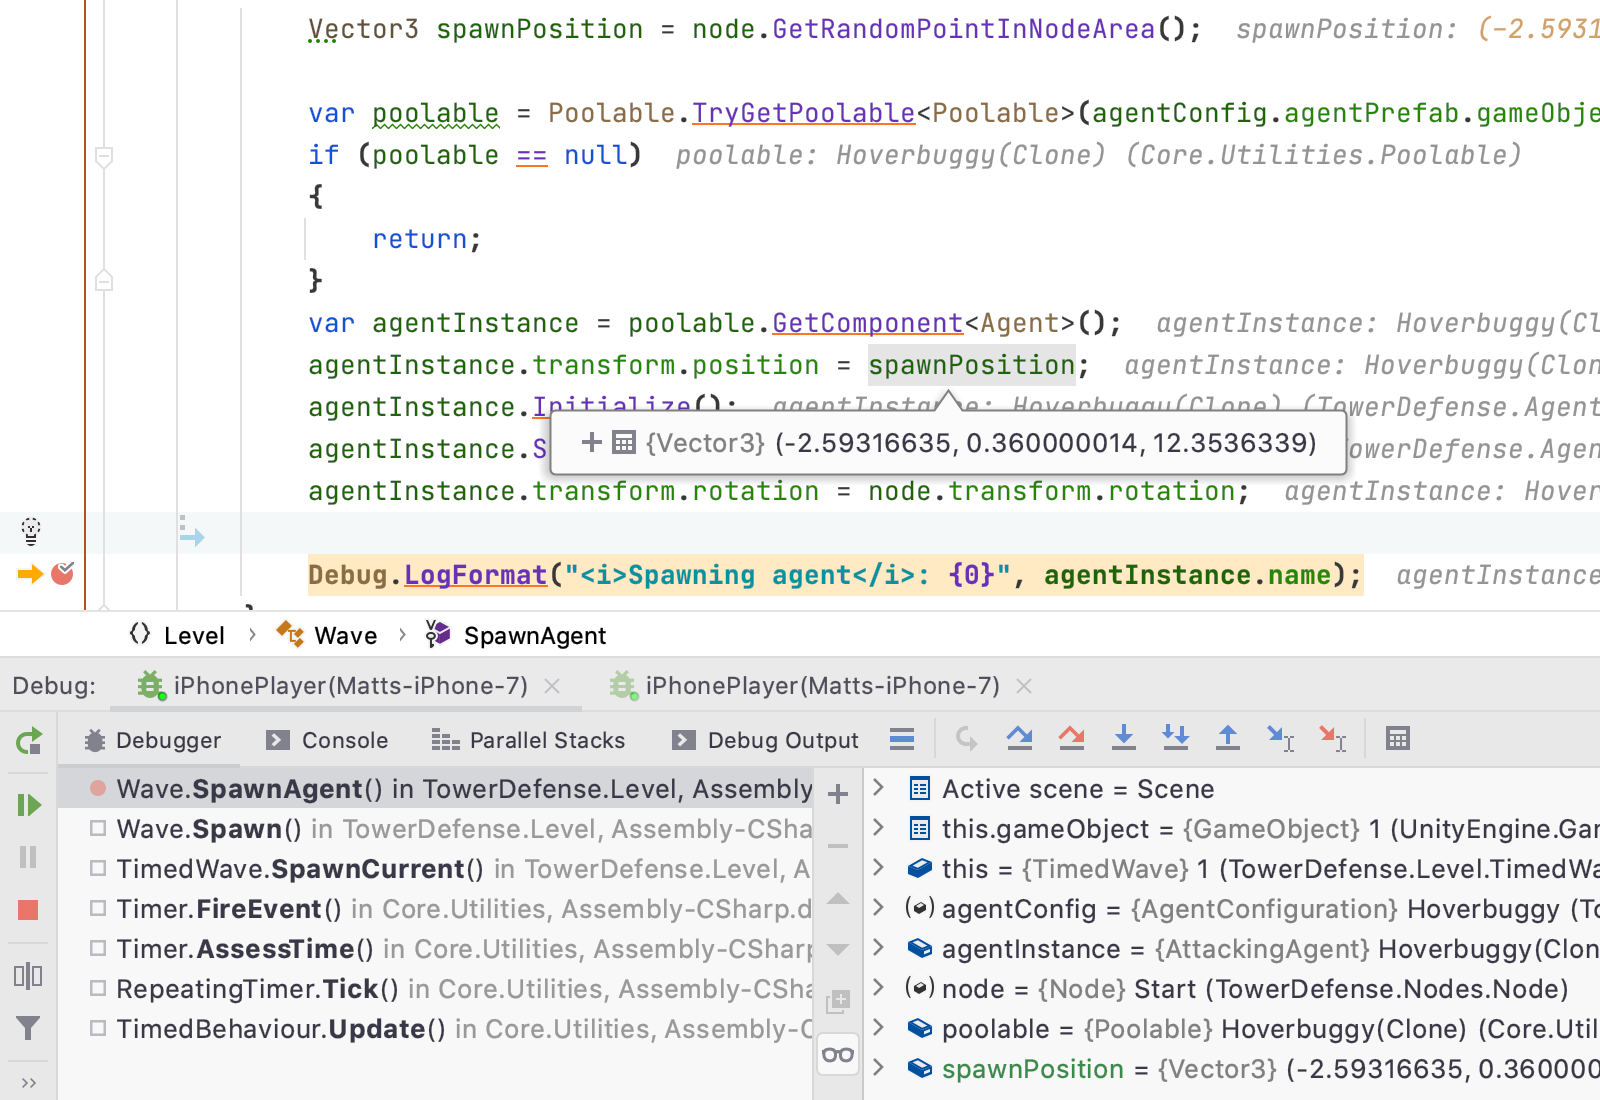
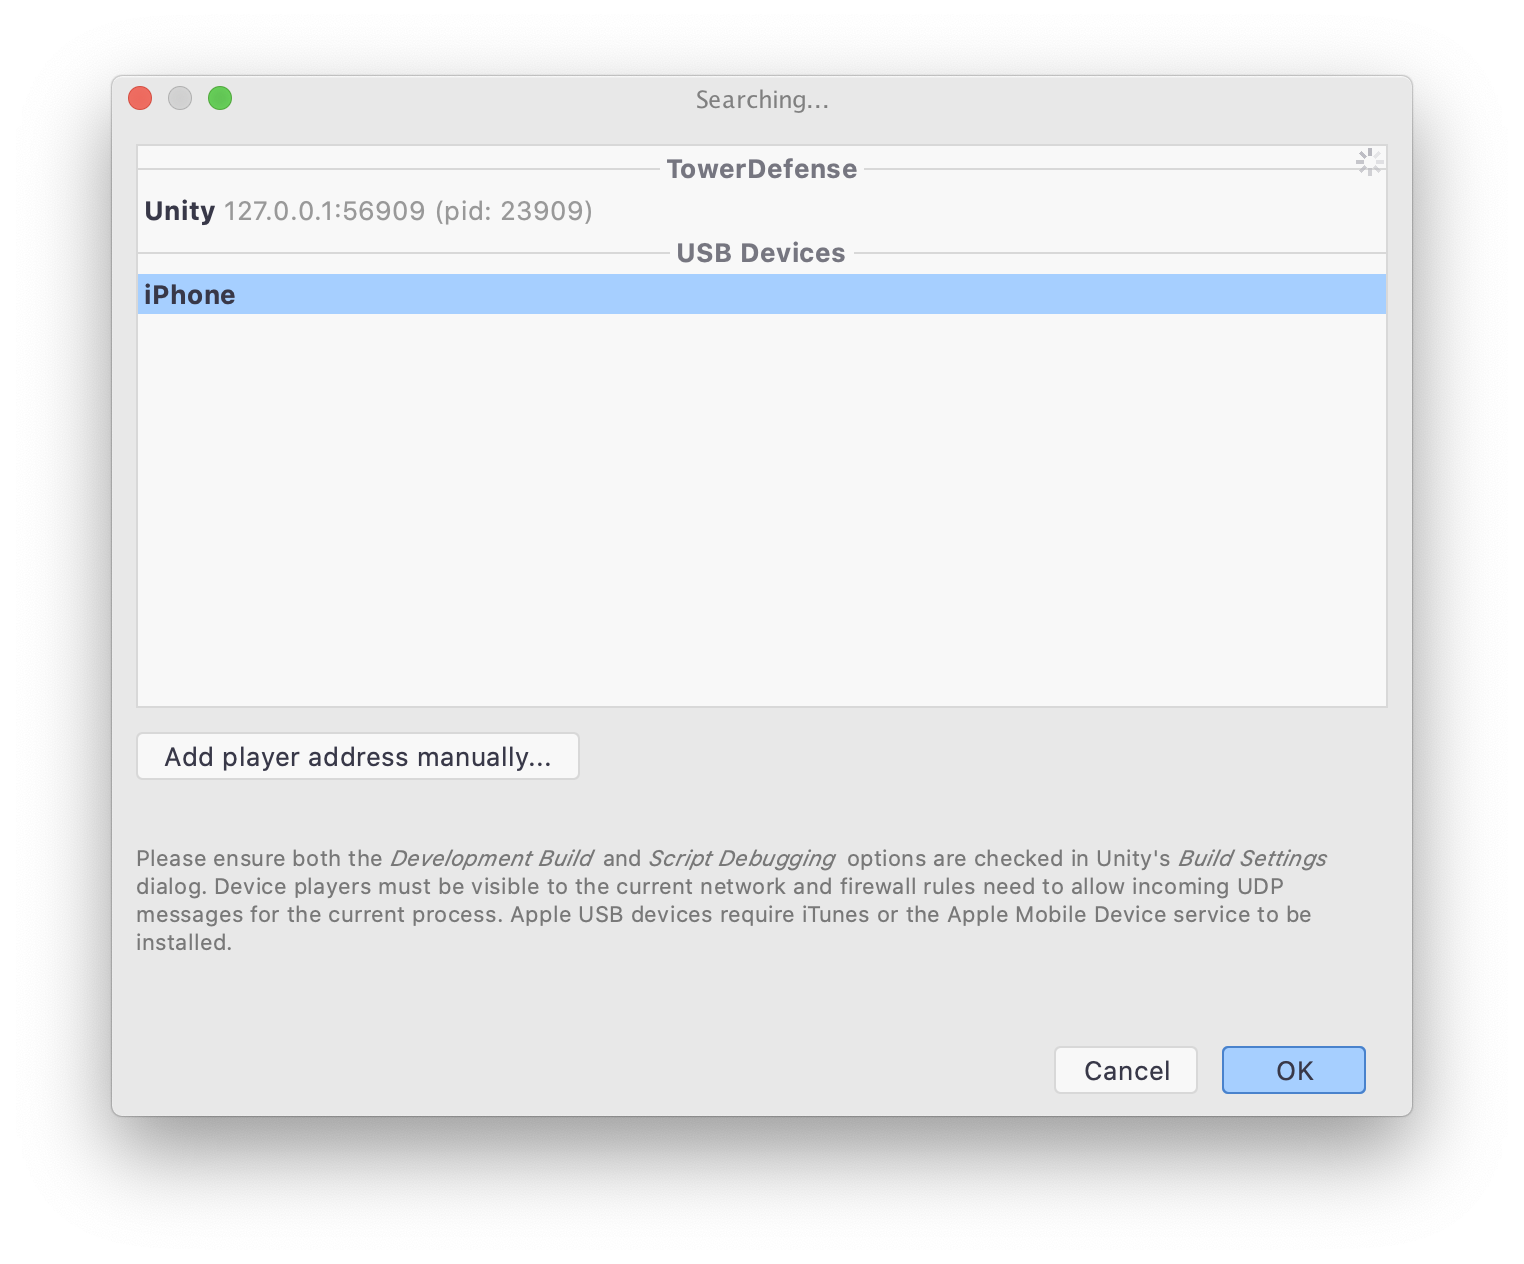
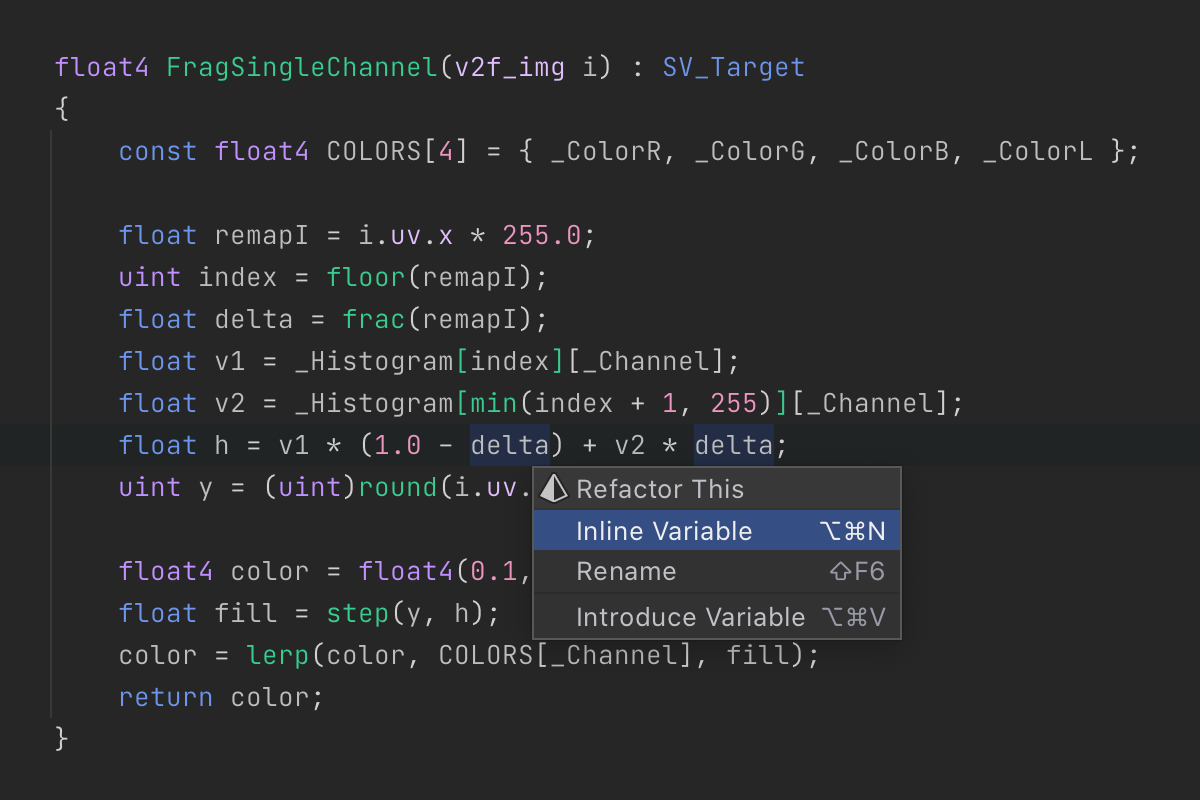
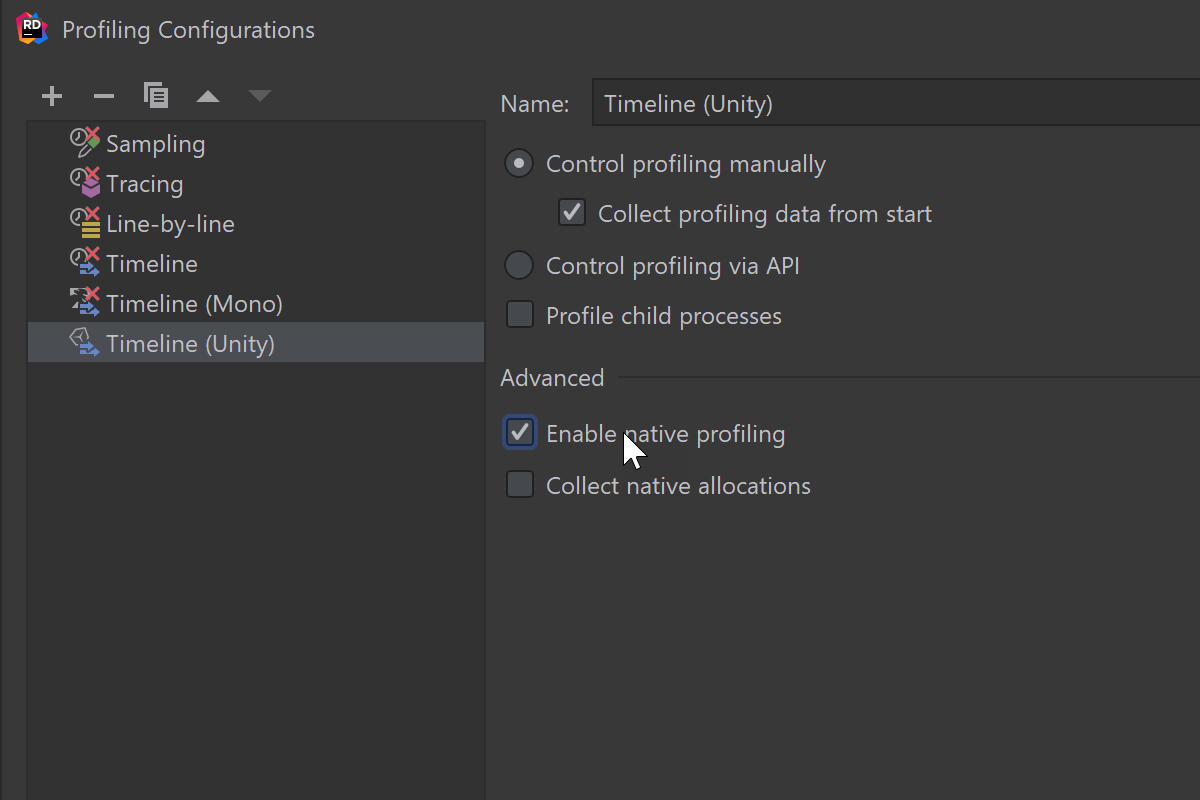
- Introducing Pausepoints for Unity in Rider 2020.2
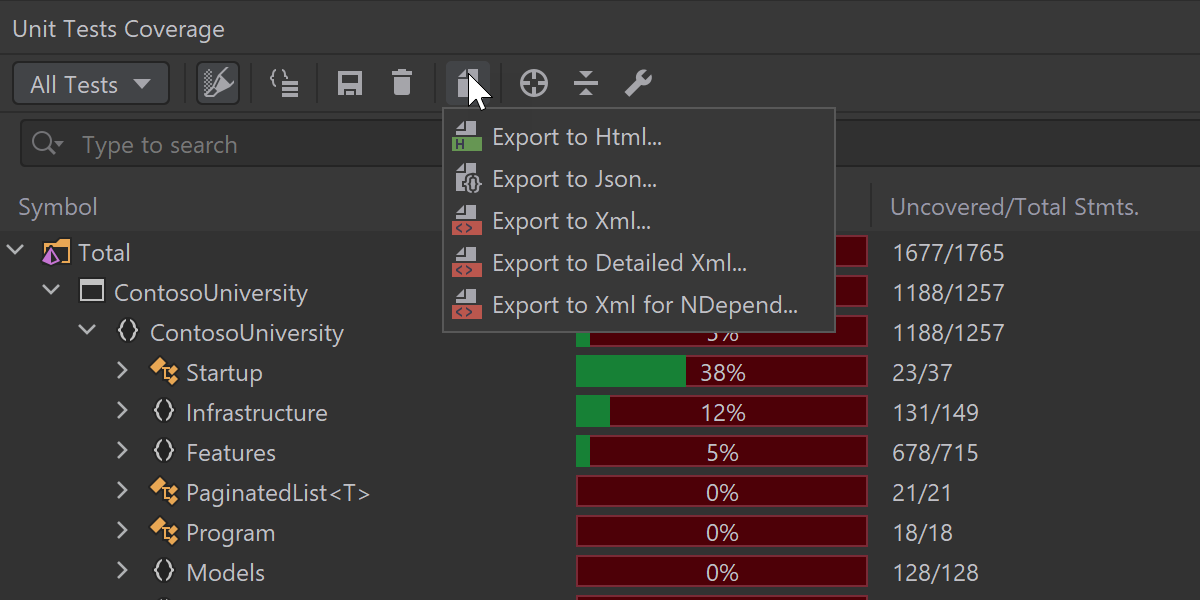
- Memory profiling on Linux and macOS with dotMemory 2020.2
Check out this fantastic offer! CODE Magazine is offering a free subscription to JetBrains customers!
If you have any interesting or useful .NET or general programming news to share via .NET Annotated Monthly, leave a comment here, email me at rachel.appel@jetbrains.com, or drop me a message via Twitter.