Quantcast
Channel: dotPeek : .NET Tools | The JetBrains Blog
Viewing all 221 articles
Browse latest View live

Creating plugins for dotPeek

$
0
0

In a previous post, we’ve seen that dotPeek supports creating and loading plugins. The NuGet plugin for dotPeek is a good example to demonstrate how to get started creating plugins for dotPeek. Sources for this plugin are available on GitHub. But let’s create a plugin of our own!

Before we start: dotPeek does not have a formal SDK yet. However it shares a lot of commonalities with ReSharper. In fact: dotPeek is built on the same platform as ReSharper reusing the project model, PSI, navigation and so on. Which is good news: we can use the ReSharper SDK (see the downloads page) to create plugins for dotPeek. Another option is to start from a class library project and work with a small NuGet package I’ve created to help you get started.

Creating a new plugin

To create a plugin for dotPeek, we can make use of the instructions provided with the ReSharper SDK. This involves a lot of project modifications so we’ll take the easy way out: we can create a dotPeek plugin by installing a NuGet package.

Install-Package JetBrains.DotPeek.PluginDevelopment

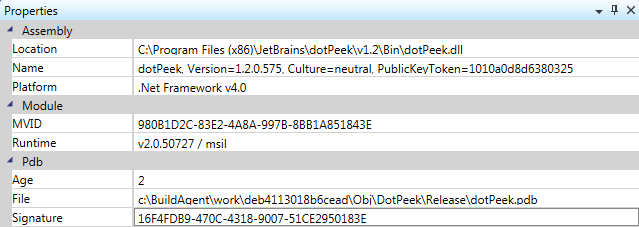
In Visual Studio, we can start out with a new Class Library project, making use of .NET 3.5 or up. Next, we can install the JetBrains.DotPeek.PluginDevelopment NuGet package into the project. This NuGet package will convert the class library we have into a dotPeek plugin by adding assembly references and several attributes. Note that the NuGet package will target the latest version of dotPeek that is installed on your system (which also means we have to have a copy of dotPeek installed).

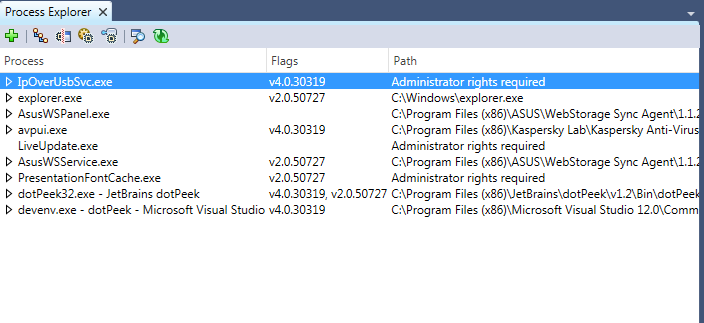
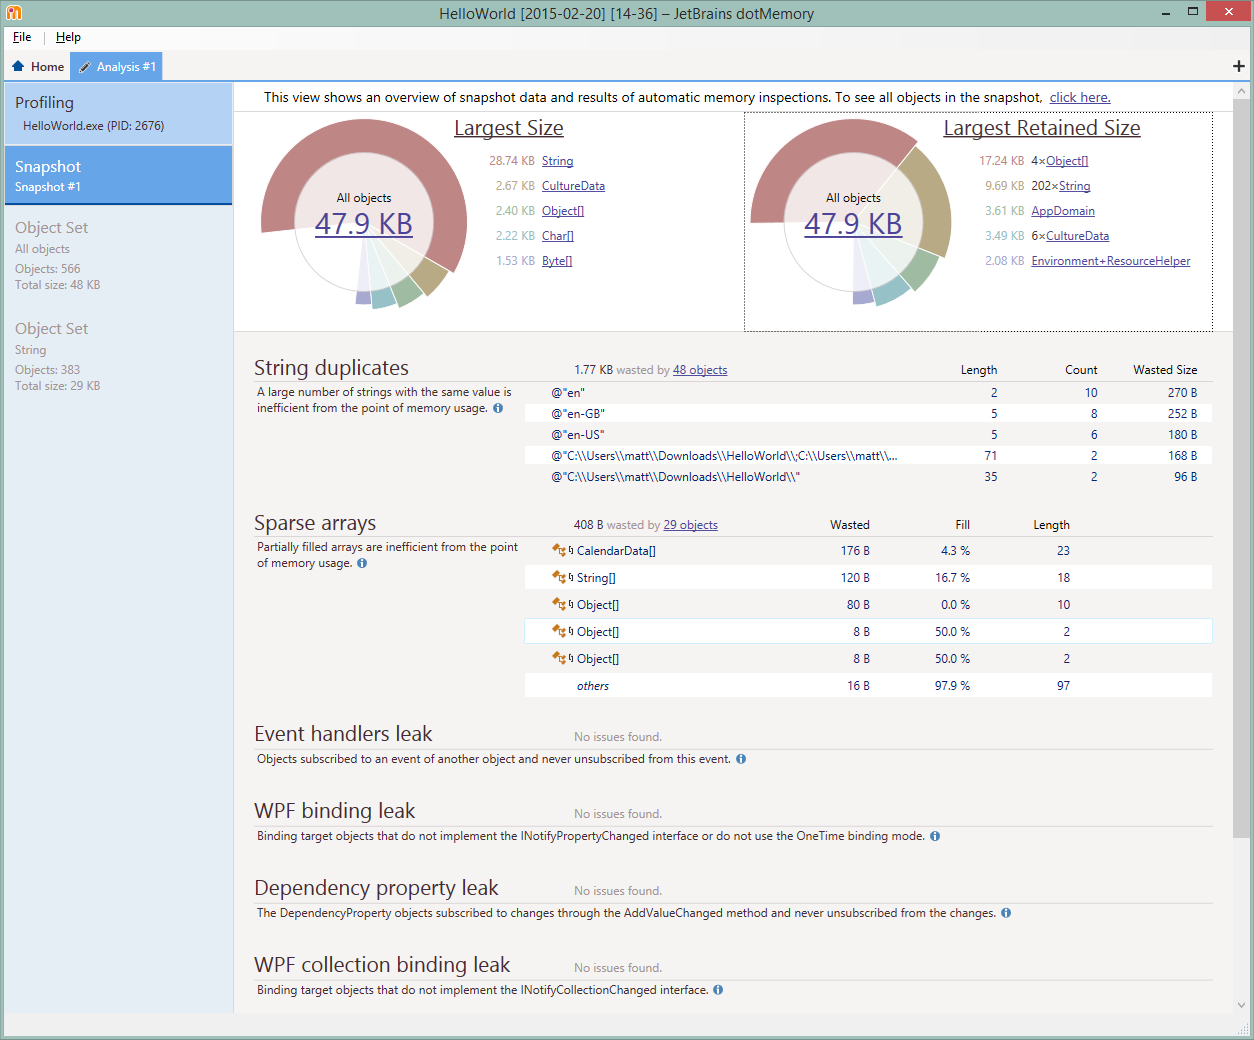
That’s everything we have to do: by running our project, dotPeek will launch with our fresh plugin loaded:

New plugin for dotPeek

Now let’s see where those menu items are coming from…

Menus, toolbars and handlers

Menu items, like the About menu we saw when loading our plugin in dotPeek, are triggered using handlers. The AboutActionHandler.cs file in our project is a sample handler implementation.

About action handler

There are some things to note here:

  • The ActionHandler attribute denotes the fact that this class is a handler with a specific name, “MyFirstDotPeekPlugin.AboutAction” in this case.
  • Handlers are added to menus and toolbars in the Actions.xml file, referencing the action name. More information on actions.xml can be found in the ReSharper plugin documentation. To make working with Actions.xml easier, the NuGet package also added an Actions.xsd containing the full XML schema we can use.
  • Handlers implement two methods of the IActionHandler interface:

    • Update – specifying whether the action is enabled or disabled.
    • Execute – the code which is executed once an action is being invoked.

    The following handler will be always available and can open a new command dialog when invoked:

    Command line tool window in dotPeek

    We can add it to a menu or toolbar by updating the actions.xml file:

    Actions.xml for plugins

    Distributing a plugin

    There comes a time when we want to make our plugin available to the public. Distributing a plugin is a simple process:

    • Distribute the assembly compiled from your project
    • Users can copy this assembly into %LOCALAPPDATA%JetBrainsdotPeekv<your target dotPeek version>plugins

    Another option is to generate a simple installation batch file, check my NuPeek plugin’s GitHub repository for more information.

    Further reading

    In this blog post, we’ve only scratched the top of the surface. With plugins, a lot of things are possible: we can add menu items, toolbar buttons, tool windows, options panes and so on. In fact, many of the features shipped with dotPeek are in fact built as plugins. It is advised to consult the ReSharper Plugin Development Guide for additional information on developing dotPeek plugins.


    Videos from JetBrains .NET Tools Evening in Prague

    $
    0
    0

    The video recordings from our JetBrains .NET Tools Evening in Prague are now available for your viewing pleasure. The December 18th event was a great success and we are already considering future cities.

    We would like to thank Dmitri Nesteruk for his sessions, our Prague team for coordinating the event, and of course all of our attendees who took their time to join us. Stay tuned for upcoming events at a location near you and in the meantime enjoy these photographs and the videos in our playlist below.

    This YouTube playlist includes:

    An Introduction to JetBrains .NET Tools Evening in Prague
    Dmitri Nesteruk gives a quick introduction to JetBrains .NET Tools Evening in Prague on December 18, 2013

    Session 1: What’s New in ReSharper 8.1
    In this talk, we’ll take a look at the new features of ReSharper 8.1. We’ll discuss the support for new technologies, new tools, refactorings, inspections and other goodies that 8.1 gives to developers.

    Session 2: How ReSharper Improves Visual Studio 2013
    With the release of Visual Studio 2013, some of you might be left wondering: is there anything that ReSharper has that VS2013 does not? Answering with a resounding YES, this session is all about the ways ReSharper enhances almost every aspect of Visual Studio as well as bringing entirely new features to the table.

    Session 3: JetBrains and .NET (it’s not just R#)
    It’s not just ReSharper that we’ve got in the .NET space! Whether you’re after code coverage, profiling or super-powered decompilation facilities, this talk will show you the tools we make to help you succeed in all these tasks.

    Session 4: Domain Specific Languages and More
    In this bonus session, Dmitri presents some of the more advanced programming concepts, talking about domain-specific languages, code generation, domain transformations as well as the ever-expanding horizons of the software development microcosm.

    Stay tuned to this blog and @ReSharper for future events.

    Introducing dotPeek 1.2 Early Access Program

    $
    0
    0

    It has been a while since dotPeek, our free .NET decompiler, received its latest update, but that doesn’t mean we put it aside. Today we’re ready to launch the dotPeek 1.2 Early Access Program that introduces a substantial set of new features.

    Starting from version 1.2 dotPeek learns to perform as a symbol server and supply Visual Studio debugger with the information required to debug assembly code. This can be most useful when debugging a project that references an assembly from an external class library.

    dotPeek listens for requests from Visual Studio debugger, generates PDB files and source files for the requested assemblies on demand, and returns them back to the debugger. dotPeek provides several options to choose exactly which assemblies you want it to generate symbol files for.

    Symbol server options in dotPeek 1.2 EAP

    To learn more on how to set up dotPeek as a symbol server and use it for debugging in Visual Studio, please refer to this guide.

    In case that the Visual Studio cache already contains PDB files for certain assemblies but you would like to replace them with PDB files generated by dotPeek, use the option to generate PDB files manually. In order to do that, simply select an assembly in dotPeek’s Assembly Explorer, right-click it and choose Generate PDB.

    Generate pdb in dotPeek 1.2

    dotPeek can export to project and generate PDB files in the background, meaning that you can explore assemblies during PDB generation or assembly export. To address cases when it’s not clear whether PDB files were generated properly, dotPeek has a dedicated tool window that shows current status and results of PDB generation.

    PDB generation status in dotPeek 1.2 EAP

    In addition to the set of features that streamline debugging decompiled code, dotPeek 1.2 adds quick search and node filtering in various trees, most notably Assembly Explorer. Searching and filtering using lowerCamelHumps is supported for these scenarios.

    Search in Assembly Explorer in dotPeek 1.2 EAP

    If you’re interested to learn about other fixes and improvements made for dotPeek 1.2 EAP, this link should help you out.

    Does the above sound enticing? Download dotPeek 1.2 EAP and give it a try!

    dotPeek 1.2 EAP: Introducing Process Explorer

    $
    0
    0

    Have you ever wanted to dig deeper into a process running on your machine? We have. That’s the reason why the new dotPeek 1.2 EAP build introduces Process Explorer.

    The Process Explorer window provides you with the list of all currently running processes and allows decompiling those of them that are .NET processes. Once you locate a process to decompile, you can add it to Assembly Explorer for further investigation by clicking the “+” button. From there, you can export decompiled code to a Visual Studio project if necessary.

    Process Explorer window in dotPeek 1.2

    You can see native processes in this window as well although you naturally shouldn’t expect dotPeek to be able to decompile them. To display native processes, click Show Native Processes in the Process Explorer toolbar.

    To display additional details about a process, for instance the .NET framework version used or MVID (which can be useful to double check that you are going to debug the right application), press F4, which should bring up a tool window displaying process properties.

    dotPeek 1.2 Process Properties tool window

    In case you’ve missed it, note that dotPeek 1.2 EAP can now work as a symbol server and supply Visual Studio debugger with the information required to debug assembly code. Download dotPeek 1.2 EAP and give it a try!

    dotPeek 1.2 Is Released

    $
    0
    0

    We have finally finished fine-tuning the new version of dotPeek, our free .NET decompiler and assembly browser. Please download dotPeek 1.2 that receives a new superpower and learns how to walk in symbol server shoes.

    dotPeek12 is released

    Highlights of this update include:

    • dotPeek can be used as a symbol server and provide Visual Studio debugger with the information required to debug assembly code. Not only can dotPeek generate source files on debugger’s request but you can even generate PDB files manually with dotPeek and watch the progress in a dedicated tool window.
    • Process Explorer window that provides you with the list of all currently running processes and allows exploring their modules and decompiling those of them that are .NET assemblies.
    • Quick search and node filtering in Assembly Explorer with lowerCamelHumps supported.

    For the full list of fixes and enhancements addressed in version 1.2, take a look at release notes.


    Get dotPeek

    ReSharper 9 hits Beta along with other JetBrains .NET tools

    $
    0
    0

    Enough of early access to the family of .NET tools, it’s time for serious business!

    Please welcome Beta releases of ReSharper 9.0, ReSharper C++, dotCover 3.0, dotTrace 6.0, dotMemory 4.2 and dotPeek 1.3.

    As all of them are now available from a single installer, you can download ReSharper 9 Beta and choose to install only ReSharper or more of our .NET tools.

    Read on for a recap of new functionality, the recommended way to submit feedback, and the list of major known issues.

    Common installer for Beta builds of ReSharper 9 and other .NET tools

    A recap of what’s new in these releases

    • ReSharper 9.0 Beta integrates into Visual Studio 2015 Preview, provides initial support for C#6.0, embeds a new Go To Action option into the Alt+Enter shortcut, introduces support for regular expressions, adds type dependency diagrams, brings more bulk quick-fixes and import actions. Client-side languages get a special treatment with 50+ new JavaScript and TypeScript quick-fixes, as well as 270 new code inspections.
    • ReSharper C++ Beta is, well, the first Beta release of a new product. The current state of C++ support in ReSharper is described here.
    • dotCover 3.0 Beta receives remote code coverage, a restyled coverage configuration dialog, a new coverage controller, as well as support for ReSharper 9 and Visual Studio 2015 Preview.
    • dotTrace 6.0 Beta introduces a completely new Timeline profiling mode for collecting temporal call stack and thread state data, refines the starting point of the profiling process with dotTrace Home view, adds more flexibility to subsystems, and supports Visual Studio 2015 Preview.
    • dotMemory 4.2 Beta learns to live on a shared platform with the other .NET tools, and therefore receives Visual Studio 2015 Preview support as well.
    • dotPeek 1.3 Beta borrows a set of actions introduced in ReSharper 9, and integrates its symbol server with ReSharper’s navigation to external sources, which basically allows setting break points in third-party code that you navigate to using ReSharper.

    Note that all JetBrains .NET tools now operate on a shared platform, which conserves resources when several products are running at the same time in Visual Studio.

    We need your feedback as soon as possible

    If you have ignored prior Early Access builds expecting to preview ReSharper and friends on a later stage, this is probably the time for you to give the updates a try. As we are on a very tight release schedule this time, we ask you to check the known issues outlined below, and if your system environment is fine, download and install the Beta releases. When you have them installed, if anything is not working, please let us know about any critical issues as soon as possible.

    If anything is going wrong, the easiest way to let us know is select ReSharper | Help | Report a Bug or Submit Feedback. In the Feedback Center window that opens, you’ll be able to briefly describe the problem you’re having, and send additional info our way: from environment information to a screenshot of your Visual Studio window to a settings file or a snapshot of your solution’s structure.

    Reporting feedback on ReSharper and other JetBrains .NET tools  from Visual Studio

    Beware of known issues

    Some things are certain to go wrong. We know them, and you should know them, too. Here are major known issues of this Beta release:

    • Running any product under Windows with a non-English locale leads to a Visual Studio crash.
    • Integration with Visual Studio 2005 and 2008 is not supported. In fact, as announced recently, support for these versions of Visual Studio is discontinued permanently. We just thought it wouldn’t hurt to reiterate this.
    • The installer only runs on 64-bit operating systems.
    • The Beta releases don’t currently support Windows XP.
    • Standalone applications (dotTrace, dotMemory and dotPeek) don’t launch under Windows Vista.

    Are you ready?

    Are you not affected by the known issues outlined above? Congratulations! Download the Beta installer and give it a ride!

    Exploring .NET Core with ReSharper Ultimate

    $
    0
    0

    We recently started the EAP for ReSharper 9.1, and it might have been easy to miss that the EAP is not just for ReSharper, but for ReSharper Ultimate – that is, our entire .NET tools product range. Starting with ReSharper 9.0, we unified the way we both build and distribute our .NET tools, so that they share a common install. This has many benefits, from licensing to sharing in-memory caches between products. So not only is it the ReSharper 9.1 EAP, but it’s the EAP for dotCover 3.1, dotTrace 6.1, dotMemory 4.3 and dotPeek 1.4.

    With EAP03, we’re introducing support for .NET Core to ReSharper Ultimate. This means you can get code coverage and performance and memory profiling for your .NET Core apps.

    But let’s back up. What’s .NET Core?

    This is Microsoft’s new, Open Source, cross platform .NET stack. It is the next generation of .NET, designed to replace the need for Portable Class Libraries by providing a common, modular .NET implementation across all platforms, including ASP.NET vNext. (One slightly confusing part is that it doesn’t replace the .NET Framework. This will still be Microsoft’s .NET stack on the Windows desktop, and will remain in use, and supported for both compatibility reasons and to support desktop apps, such as WPF.)

    It’s made up of a couple of pieces – the CoreCLR project is the runtime, containing the JIT and the Garbage Collector, and the Base Class Library is being reimplemented in the CoreFX project.

    One of the nice things about a .NET Core application is that it is xcopy deployable. That is, .NET Core apps don’t require an install, or a GAC, or anything. All of the files required to run an application can live in a single folder.

    Explorer showing the files in the HelloWorld sample

    This test application is the HelloWorld app from the CoreFX Lab repo. As we can see, the folder contains everything we need to run the application. The BCL System assemblies are present, perhaps a few more than you’re used to on the desktop – this allows for a more modular distribution of the BCL, only distributing the assemblies you use. You can also see mscorlib.dll, which provides the primitive types, such as Object and String, and coreclr.dll, which is the actual runtime, including the JIT and the garbage collector. Most interestingly, we have three other files – HelloWorld.dll, CoreRun.exe and HelloWorld.exe.

    dotPeek showing decompiled code

    If we take a look at these files in dotPeek, we can see that the System assemblies and HelloWorld.dll are just normal looking assemblies, although they’re now targeting .NET Core v4.5, rather than the .NET Framework. Furthermore, we can see that HelloWorld.dll contains our Program class, with a normal static Main method – this is the entry point to the application. And coreclr is listed as “not supported”, as we know that’s a dll containing the native code for the runtime itself.

    So what are HelloWorld.exe and CoreRun.exe?

    These files are also coming up as “not supported” in dotPeek, and if we look at the their file sizes, we see that they’re both very small, only about 40Kb each. These files are native stubs, and are used to bootstrap the .NET Core runtime and launch the .NET application. The stub will load coreclr.dll, initialize the runtime and point it to the managed code to run.

    The CoreRun.exe process is a generic launcher that requires the HelloWorld.dll to be passed in as a command line parameter, and provides extra command line parsing to enable attaching a debugger, and providing verbose output. The HelloWorld.exe process is simpler, and requires no command line parameters, automatically launching HelloWorld.dll and passing any command line parameters to the .NET application.

    These stubs are required for .NET Core primarily to allow for running cross platform. Traditional .NET Framework applications combine the bootstrap stub and the .NET application code and metadata (HelloWorld.dll) so the .NET application just works transparently (in fact, versions of Windows later than Windows XP recognize .NET applications at the Operating System level, and bootstrap the .NET Framework automatically). But if we want to run the HelloWorld .NET application on OS X or Linux, then we can’t just run HelloWorld.exe – other operating systems don’t know how to launch .exe files, and might not even be Intel-based! So on other operating systems, the stub can be replaced with another executable, without having to replace the .NET application.

    Image of HelloWorld console application running

    We can dive deeper into .NET Core applications, by profiling and analyzing them at runtime.

    We can use dotCover to provide code coverage – note that DrawWindows is being called, but not DrawLinux or DrawMac. (While .NET Core is cross-platform, ReSharper Ultimate is a set of .NET Framework applications, using WPF, and as such, tied to Windows.)

    dotCover showing coverage for the HelloWorld application

    Performance profiling is handled by dotTrace, which can provide a nice timeline view of the performance of a .NET Core application, with powerful filtering capabilities to filter based on CPU, CPU state, thread and so on. Hopefully you’ll be working on slightly more interesting applications!

    dotTrace showing performance information about HelloWorld application

    And finally, dotMemory will allow you to examine the memory allocations of .NET Core apps, too.

    dotMemory analysing memory snapshot of HelloWorld application

    All of this support for .NET Core is handled transparently by ReSharper Ultimate. You simply need to start profiling or coverage for a .NET application, passing in either of the stubs as the startup application, and ReSharper Ultimate will do the rest.

    Also, this is initial support. There are a few things that aren’t working correctly just now, but we’re working on them, and they should be fixed in future EAP builds.

    Grab yourself a copy of the latest EAP and give it a go. There’s more to come. Stay tuned!

    ReSharper 10 EAP 2

    $
    0
    0

    We have launched EAP for ReSharper 10 about a week ago with a set of fixes and improvements to JavaScript and TypeScript. We hinted that we had more to offer as soon as we merge the new material. Today is the day when we start delivering. ReSharper 10 EAP 2 adds considerable changes in ReSharper itself, as well as in two other ReSharper Ultimate tools: ReSharper C++ and dotPeek. Below is the list of highlights:

    ReSharper

    Out-of-the-box postfix templates

    Do you know postfix templates? There’s a ReSharper plugin started over 2 years ago that has since garnered quite a lot of following. The idea has even been implemented in IntelliJ IDEA and its derivative products and made available out of the box. In ReSharper 10, in order to close the circle, we’re including postfix templates into core ReSharper, and this is already available in ReSharper 10 EAP 2.

    From now on, without installing any plugins, you can enjoy postfix templates in C#. For example, you can start with an expression and proceed to wrap it in an if statement to check whether it returns true.

    More than that, if you’re dealing with null checks on a regular basis, use .null and .notnull postfix templates:
    ReSharper's postfix template to check if something is not null (before expanding)
    This will both check if the selected entity is not null and wrap it in an if statement:
    ReSharper's postfix template to check if something is not null (after expanding)
    Need to throw an exception if the condition is met? Enter the exception class name, then a dot, and look what we’ve got here:
    ReSharper's postfix template to throw an exception (before expanding)
    After selecting the .throw template, you have the complete throw statement, and the caret in place to enter arguments:
    ReSharper's postfix template to throw an exception (after expanding)

    Usage-aware Go to declaration

    In other news, ReSharper 10 EAP 2 extends the functionality of Go to declaration (as well as Ctrl+click) so that you can also use the shortcut to look up usages.

    In the easiest case where you have one declaration and one usage, you can use Go to declaration to simply switch between them: you’re simply enabled to use a single shortcut instead of two different shortcuts.

    If you have multiple usage of a symbol, here’s what you can do:

    • Invoking Go to declaration on a usage for the first time gets you to the declaration as you would expect.
    • Invoking Go to declaration for the second time (when already on the declaration) gets you back to the usage where you came from.
    • Subsequent Go to declaration hits take you to further found usages of the symbol, one usage at a time. Navigation between usages is aided by a Find Usages-like pane that enumerates found usages, contains additional controls to mouse-click between usages, and helps you flush all found usages to the regular Find Results window if you feel like doing this.
      A pane that shows found usages for the extended Go to Declaration

    Needless to say, at any point you can hit Esc to revert to the traditional, non-usage-aware Go to declaration.

    Further fixes

    We’ve fixed more red code in Xamarin.Forms projects and elsewhere. Other fixes are scattered across TypeScript support, Feedback Center, code completion and Code Cleanup, among other subsystems. Here’s the (hopefully) full list of fixes in ReSharper 10 EAP 2 if you’re interested in details.

    ReSharper C++

    The ReSharper C++ team has basically merged everything they’ve worked for since mid August. There are about 90 issues closed during the time span, and the list is highlighted by the following:

    • A new context action to create derived class when standing on a class declaration:
      Create derived class action in ReSharper C++
    • New context actions to replace decltype with the underlying type, as well as to substitute a template type alias:
      Substitute template type alias
    • A new gutter icon (in addition to a code inspection and a quick-fix) that displays whenever ReSharper C++ detects that one local declaration hides another local declaration:
      Declaration hides previous local declaration

    Other notable changes include a more elaborate way to determine that a function can be made const, support for functions marked with [[noreturn]] and __declspec(noreturn) attributes, a generate action that creates Google Mock stubs, and a way to navigate from a function declaration’s parameter to the corresponding parameter in the function’s definition.

    dotPeek

    The dotPeek team has implemented one of the most anticipated features: you can now navigate to IL code from any point in the C# decompiled code viewer:
    Navigate to IL code viewer in dotPeek
    IL code is shown in a separate tool window that is synchronized with the main code viewer:
    dotPeek IL viewer tool window

    IL code support is not yet implemented in ReSharper but we’ll be working on that as well.

    In another considerable change, dotPeek now supports the same set of color themes as Visual Studio does: for example, you can select Blue or Dark theme, or choose to synchronize your color scheme preference with Visual Studio settings.
    Dark theme in dotPeek

    What’s next?

    If the changes described above are relevant to you, you’re more than welcome to download ReSharper 10 EAP 2.

    We have more significant changes waiting in line to be made public in further EAP builds. Stay tuned.


    ReSharper 10 EAP 4

    $
    0
    0

    This past weekend we have published a new ReSharper 10 EAP build, along with compatible builds of other ReSharper Ultimate tools. This time notable changes are available in ReSharper, ReSharper C++ and dotPeek. Let’s see exactly what the latest EAP has in store.

    ReSharper

    NUnit 3.0 Beta 4

    As the new major version of NUnit is approaching release, we have laid the groundwork to support it in ReSharper test runner. We’ll definitely need to make more changes in order to support the release version of NUnit 3.0 but this far, the latest Beta 4 is supported.
    ReSharper starts to support NUnit 3.0

    Note that at this point, there’s a critical issue with NUnit 3.0 Beta 4 support in that you can’t run inherited tests in hierarchies of fixtures. We’re looking to fix this although we might need help from the NUnit team.

    Device family-specific views in UWP applications

    Universal Windows Platform enables using device family-specific XAML views to provide different UI for different types of devices. We have taught ReSharper to handle this technique with dedicated code inspections, quick-fixes and context actions.
    Quick fixes to support device family-specific XAML views in UWP applications

    Other changes

    For your information, here’s the full list of fixes that made it into ReSharper 10 EAP 4.

    dotPeek

    Async Find Usages

    dotPeek has introduced the non-modal, async Find Usages mechanic that has been available in ReSharper since version 9.1, which lets you keep on working with the decompiler while it executes a long usage search in the background.

    More ways to view IL code

    In other news, you can now opt to show IL code as comments to decompiled C# code, which effectively merges its default text viewer and the normally separate IL Viewer window, all in one view. This is not a default, and you should select Show IL code in comments in dotPeek options in order to turn this mode on.

    IL code shown as comments in dotPeek

    Finally, you can now make dotPeek display IL code not only for decompiled code but also for source code reproduced from symbol files.

    ReSharper C++

    In addition to a set of fixes, this ReSharper C++ EAP build includes a set of noteworthy changes:

    • Support for designated initializers defined in C99.
    • More ways to generate definitions inline via context actions and the Generate dialog.
    • A code inspection and a quick-fix to make functions static when possible.

    What’s next?

    We’re planning to release further EAP builds, hopefully more than once a week. However, very soon we’ll be wrapping up development so that we can meet the target release date for ReSharper 10 and other ReSharper Ultimate tools, which is set to November 2.

    All ReSharper Ultimate tools bumped up to version 10

    $
    0
    0

    If you have started to use ReSharper 10 EAP (build 4 or later), a strange detail might have caught your attention:

    Several v10 products as seen in the ReSharper Ultimate installer

    Wut? Is it a bug? OK, ReSharper was meant to be versioned 10 but other Ultimate tools clearly weren’t.

    Well, there’s no mistake. We have decided to align versioning across the entire ReSharper Ultimate family starting with ReSharper version 10.

    Also, by virtue of this uniform versioning, we can finally refer to the entire set of tools as ReSharper Ultimate 10.

    Granted, it’s bizarre for some products to make a switch like this: for example, dotPeek jumps from 1.5 to 10 and ReSharper C++ leaps from 1.1 to 10.

    However, there’s a legitimate reason behind this.

    Before last year, ReSharper, dotCover, dotTrace and other JetBrains .NET tools used to evolve more or less independently from each other, without much coordination. This all changed with the advent of ReSharper Ultimate, which brought a common installer, a common set of assemblies shared between all tools, a synchronized release cycle and unified licensing.

    Along with all the advantages of the new approach, it brought a new restriction: if you were to use multiple tools from the ReSharper Ultimate pack, you could only use versions released simultaneously. Installing, say, ReSharper 9.1 released in April 2015 alongside dotMemory 4 released in December 2014 wasn’t possible anymore: you had to make sure that versions you installed were aligned in terms of release dates.

    However, disparate versioning used by different ReSharper Ultimate tools didn’t help anyone figure out which versions were compatible and which were not.

    Taking all this in mind, we sat down and thought, which of the two main considerations behind versioning was more relevant at this point in ReSharper Ultimate history: a way to indicate which releases of each particular product had more important changes than its other releases, or a way to unequivocally identify which ReSharper Ultimate products were guaranteed to work alongside each other.

    In the end, although it wasn’t apparent to everyone and took quite a while to agree on, we figured that the latter was more important today and going forward.

    In practical terms, the new versioning should be read as follows:

    • ReSharper Ultimate products having the same version (10 and onward) are guaranteed to be compatible.
    • Advancing a version number (10 to 10.1 or 10.2 to 11) will usually indicate considerable changes in the flagship product, ReSharper. Other Ultimate products may or may not receive comparable changes but will still advance their version numbers accordingly in order to make absolutely clear that they are expected to work with each other.

    While we realize that this change is somewhat unorthodox, we’re really hopeful that in practice it helps you figure out more easily which combinations of ReSharper Ultimate tools are safe to be used together.

    Welcome ReSharper Ultimate 10 RTM

    $
    0
    0

    We are here to let you know that the final release of ReSharper Ultimate 10 is now available for download!

    ReSharper Ultimate 10

    As described earlier, all ReSharper Ultimate family tools now share a common version number to simplify dealing with compatibility issues, so please welcome ReSharper 10, ReSharper C++ 10, dotTrace 10, dotCover 10, dotMemory 10 and dotPeek 10.

    Watch this video for an overview of what is new in ReSharper Ultimate 10:

    Here is a quick recap of what is new for each of the tools, if you prefer text.

    ReSharper 10

    In addition to around 450 fixes, highlights of ReSharper 10 include:

    • ReSharper Build is a new out-of-process incremental build tool that can take advantage of multiple processes, visualizes different kinds of project build status, and is optimized for large solutions with lots of dependencies. ReSharper Build
      Read this post for more details on ReSharper Build.
    • Built-in postfix templates. One of the most popular plugins gets integrated into mainline ReSharper. Postfix templates allow reducing backward caret jumps while typing C# code. For example, you can start with an expression and proceed to wrap it into an if statement to check whether it returns true. Another template allows you to throw an exception if certain condition is met. Postfix templates
    • Usage-aware Go to Declaration. ReSharper 10 extends the functionality of Go to declaration (as well as Ctrl+click) so that you can also use the shortcut to look up for usages. In case you have one declaration and one usage, you can use Go to declaration to simply switch between them. If you have multiple usage of a symbol, subsequent Go to declaration hits will take you to further found usages of the symbol, one usage at a time. Navigation between usages is aided by a Find Usages-like pane that enumerates found usages, contains additional controls to mouse-click between usages, and helps you flush all found usages to the regular Find Results window if you like. Usage-aware Go to declaration
    • Code style improvements. ReSharper 10 comes with a set of changes aimed to simplify configuration of and complying with code style settings. Inspection severity can now be configured right from the Alt+Enter menu, without using a modal window. Find similar issues window is now used only for searching in a custom scope. All default scopes, such as solution, project and file, can be applied right from the same old Alt+Enter menu. Additionally, there are new code inspections with quick-fixes that detect explicit or implicit access modifiers for types and type members, let you use a pre-configured order of modifiers, and help you join or separate attributes in a section.
    • Refined Stack Trace Explorer. Stack Trace Explorer was basically rewritten from scratch in ReSharper 10. This enabled Stack Trace Explorer to provide links to types in addition to methods and to parse more types of data, including WinDbg GCRoot dumps, Visual Studio Call Stack tool window contents and dotTrace snapshots.
    • NUnit 3.0 Beta 5 support. As the new major version of NUnit is approaching release, we have laid the groundwork to support it in ReSharper unit test runner. We will make more changes in order to support the release version of NUnit 3.0, though at this point the latest Beta 5 is supported.
    • JavaScript and TypeScript support improvements. Support for JSX syntax is now available in .js, .jsx and .tsx files to streamline React development in ASP.NET applications. Code completion, all ReSharper regular context actions for HTML and JavaScript, navigation to declarations and search for usages, as well as a couple of refactorings are available as well. JavaScript regular expressions that were originally supported in ReSharper 9.2 are now covered in more detail. TypeScript 1.6 support has been finalized with the addition of intersection types and class expressions. Moreover, code completion for JavaScript is now aware of types from JSDoc comments.
    • UWP device family-specific views. Universal Windows Platform enables using device family-specific XAML views to provide different UI for different types of devices. ReSharper 10 learns to handle this with dedicated code inspections, quick-fixes and context actions.Code inspections for UWP device family
    • Google Protocol Buffers (Protobuf). ReSharper 10 starts to provide support for .proto files. This includes syntax highlighting, code analysis, code completion and navigation for both 2.x and 3.0 Protobuf versions.

    ReSharper C++ 10

    ReSharper C++ 10 comes with 200+ fixes and a variety of enhancements:

    • Improved support for C language. ReSharper C++ 10 provides full support for C99, including designated initializers. C11 is supported to the same extent that Visual Studio supports it. Code completion and some context actions that are specific for C language are introduced with this release as well.Code completion for C in ReSharper C++
    • New context actions. There is a new action to create a derived class when standing on a class declaration. Other new context actions help replace decltype with the underlying type, as well as substitute a template type alias.
    • New code inspections and quick-fixes. We’ve introduced a new code inspection that detects whether a class needs a user defined constructor with a quick-fix to generate it. Another new code inspection detects uninitialized base class in a constructor and offers a quick-fix to initialize it. Additionally, we added quick-fixes for mismatched class tags highlighting, a quick-fix to add a template argument list and a quick-fix to make base function virtual.Make base function virtual quick-fix
    • ReSharper C++ 10 inherits the updated usage-aware Go to declaration mechanic from the mainline ReSharper. From now on you can use the single shortcut not only to switch from declaration to definition, but also to navigate through usages.
    • Code generation. ReSharper C++ 10 allows generating definitions for a function inline. We’ve also added support for generating Google Mock stubs for those who use Google Test framework.
    • Performance was one of our priorities for this release, and as a result ReSharper C++ 10 works significantly faster on solutions that had already been cached.

    dotCover 10

    The main highlight for dotCover 10 release is the long-awaited Continuous Testing functionality. Following an initial code coverage analysis of your solution, dotCover 10 learns to track your code changes, figure out which tests are affected by them, and then it can re-run the affected tests as soon as you hit Save, or use a different strategy of reacting to code changes.
    Continuos testing session in dotCover 10

    dotTrace 10

    dotTrace integration in Visual Studio has been considerably improved with this update. With dotTrace 10 when you choose to profile your startup project from Visual Studio in Timeline mode, you can view the resulting snapshot right in Visual Studio, using the Performance Profiler tool window. You can select a particular time frame to investigate and drill into, make use of several filtering options, as well as export and save snapshots, all without leaving Visual Studio.
    dotTrace 10 Timeline viewer in Visual Studio

    dotMemory 10

    dotMemory 10 introduces a new contextual option that lets you navigate from a type in an object set to its type declaration in an open Visual Studio instance. If the target type is a library type, this triggers ReSharper’s decompiling functionality and opens decompiled code in Visual Studio.
    dotMemory 10 Find declaration in VS action

    In addition, dotMemory receives a start view similar to dotTrace Home. The new dotMemory Home screen can be used as a starting point to memory profiling that lets you launch a new local or remote profiling session, attach to a running process, configure a profiling session and more.

    dotPeek 10

    dotPeek 10 delivers one of the most heavily requested features: you can now navigate to IL code from any point in the C# decompiled code viewer. IL code can be shown in a separate tool window or as comments to C# decompiled code.

    IL viewer in dotPeek 10

    Find Usages in dotPeek now works asynchronously, similarly to how it does in recent versions of ReSharper. This means that even if you started to look up for usages, you can still work with dotPeek without needing to wait until it finalizes the search.

    In other news, dotPeek 10 supports color themes: you can now select one of 3 default themes, or choose to synchronize your color scheme preference with Visual Studio settings.


    Get ReSharper Ultimate 10

    Licensing and upgrade options

    In terms of licensing and upgrades, some changes are introduced with this release:

    • ReSharper 10 is a free upgrade for you if you have a valid ReSharper upgrade subscription. ReSharper C++ 10 is free if you have a valid upgrade subscription to ReSharper C++.
    • In case your upgrade subscription expired, you can now subscribe to ReSharper, ReSharper C++, ReSharper Ultimate or All Products pack with a discount and get the second year of subscription for free. For details on how new subscription-based licensing works, please see JetBrains Toolbox.
    • Starting from November 2, 2015 dotTrace, dotCover and dotMemory are only licensed as part of ReSharper Ultimate. Read this post for details.
    • If you need a formal quote or any other assistance, you are welcome to contact JetBrains sales.

    Enters ReSharper Ultimate 10.0.2

    $
    0
    0

    Download ReSharper Ultimate 10.0.2, which includes a slew of bug fixes and improvements to ReSharper, ReSharper C++, dotTrace, dotMemory, dotCover and dotPeek.

    ReSharper Ultimate 10.0.2

    Highlights of this update

    • Unit testing. In addition to support for NUnit 3.0 RTM, unit testing has seen noticeable improvements in terms of support for test cases and grouping, handling of debugging sessions, time spent for setup and teardown code runs. Many presentation glitches in Unit Test Sessions have been fixed as well.
    • Bogus red code. We have fixed incorrectly highlighted red code in solutions containing .modelproj and .wixproj project types, as well as in DNX projects, projects targeting .NET Framework 4.6 and portable libraries.
    • ReSharper Build. There’s an array of improvements in the way ReSharper Build works, notably with regard to monitoring changed dependencies, respecting settings that govern whether to display results upon completing a rebuild, and better support for specifics of Visual Studio 2015.
    • JavaScript and TypeScript. Improvements include a performance tuneup, as well as fixes to incorrect code inspections, usage search and navigation.
    • In other news, Stack Trace Explorer has received a set of fixes; you can now disable ReSharper code tooltip if you prefer how other Visual Studio extensions decorate the tooltip; introducing a variable from inside a lambda expression doesn’t produce broken code anymore; and you can export items from File Structure again!

    ReSharper C++, dotCover, dotTrace, dotMemory and dotPeek have received their varying shares of bug fixing in the past month but it’s ReSharper that leads the breed in terms of sheer number of improvements. For your reference, this is how distribution by subsystem looks like for issues fixed in ReSharper 10.0.2:

    ReSharper 10.0.2: fixed issues by subsystem

    If you’re interested, here’s the entire list of fixes across ReSharper Ultimate products.

    Important note to Visual Studio 2015 users

    If you have migrated to Visual Studio 2015, please make sure to install VS2015 Update 1. This is especially important if you are experiencing Visual Studio freezes upon starting debugging, pulling from your VCS repository, starting a refactoring, editing XAML in visual mode or in other scenarios described in comments to RSRP-450181. Visual Studio 2015 Update 1 is known to fix a part of MSBuild calls that these freezes are usually traced back to.

    Time to download

    Upon reading the above, we hope you’re now well prepared to download and install ReSharper Ultimate 10.0.2.

    This release wraps up the year for the .NET team here at JetBrains. We’d like to welcome 2016, and we’re hoping to open EAP for a new ReSharper Ultimate release sometime in January.

    ReSharper Ultimate 2016.1 is released

    $
    0
    0

    We’ve just finalized an update to ReSharper Ultimate and welcome you to download Resharper Ultimate 2016.1 RTM!

    Watch the following video for a summary of what is new in ReSharper Ultimate 2016.1, or read on for the main highlights of this release:

    ReSharper

    Along with 950+ fixes, major highlights of ReSharper 2016.1 are the following:

    • A variety of new context actions: ReSharper 2016.1 brings a set of new Alt+Enter actions to check method input parameters, manipulate strings, convert strings to objects, comment and uncomment code selections, and many more!
    • A new Invert Boolean Member refactoring. The refactoring can be invoked on a method, property, local variable or a parameter to invert the boolean value it returns and update other members that receive values from it.
      Invert Boolean Member refactoring
    • Smart Paste feature that ensures the right escaping in string literals that you copy/paste around your code. It works in C#, VB.NET, JavaScript, XML, XAML and HTML files. Smart Paste
      Two new context actions, “Convert XML string to a LINQ to XML object” and “Convert JSON string to a Newtonsoft JSON.NET object”, complete the workflow of transferring existing XML or JSON into C# code.
    • Asynchronous Find Code Issues. Starting with version 2016.1, Find Code Issues works in the background both in ReSharper and ReSharper C++. This lets you keep editing or navigating your code while ReSharper runs its analysis.
    • New WCF-specific code inspections, quick-fixes and context actions.
    • Initial support for Node.js. All ReSharper goodies you are well familiar with, like completion, code inspections, quick-fixes, and navigation features are now available for Node.js.
      Node.js support
    • ReSharper 2016.1 is way better at understanding VB.NET 14, introducing support for string interpolation, multi-line strings, null-conditional operators, partial modules and interfaces, year-first date literals and XML documentation comments.
    • Out-of-the-box xUnit.net support. ReSharper 2016.1 provides built-in support for xUnit.net and doesn’t require a separate extension to be installed anymore. This means ReSharper will discover your xUnit.net tests and allow you to run and debug them right from the editor.
    • Support for JSON files and schemas includes the File Structure view, a “Convert JSON string to a Newtonsoft JSON.NET object” context action, JSON schema-aware code completion, inspections and quick-fixes.
      JSON file structure
    • JavaScript and TypeScript support enhancements include a reworked Rename refactoring (which can now rename files corresponding to TypeScript types), granular formatter settings, and full support for TypeScript 1.8. In addition, ReSharper starts to properly handle some bits of TypeScript 2.0: readonly properties, implicit indexers, private and protected constructors, abstract properties, and nullable types. Please expect a separate blog post describing TypeScript and JavaScript support in ReSharper 2016.1 shortly.
    • JSDoc improvements. ReSharper can now parse generics, HTML markup, and parameters with properties in your JSDoc comments. Everything that ReSharper infers from JSDoc becomes immediately available in code completion suggestions.
    • Code style features keep improving. Code styles can now be applied with a single command, ReSharper | Edit | Apply Code Style (Ctrl+Alt+S). Reformat Code, Apply Code Style and Run Code Cleanup commands are now accessible from Alt+Enter menu when you make a selection in the editor. In addition, a dedicated action for reformatting code is back, and it can be invoked from the main menu (ReSharper | Edit | Reformat Code) to reformat code depending on the context. Another improvement covers the use of braces, which ReSharper now helps you make consistent across your code base. Preferences for each kind of code block can be configured separately in a code style options page, and ReSharper makes sure to respect these preferences:
      Quick-fix to add missing braces
    • Intermediate Language viewer is now built into ReSharper. The IL Viewer, which first appeared in dotPeek 10, is now available for drilling down library code right in Visual Studio. To check how it works, navigate to any library symbol (which can be as easy as Ctrl-clicking it), and then choose ReSharper | Windows | IL Viewer in the menu.
    • Optimize References learns to handle NuGet references, and Remove Unused References starts to support NuGet references as well.
      Analyze NuGet references

    ReSharper C++

    ReSharper C++ 2016.1 comes with 270+ fixes and a set of larger improvements:

    • To-do Explorer: ReSharper C++ 2016.1 introduces the long-awaited navigation view, which lets you view, group and filter comments that contain one of the 3 default to-do patterns (Bug, Todo and Not Implemented) and any custom patterns that you might want to set up.
      To-do explorer in ReSharper C++ 2016.1
    • New context actions and quick-fixes. ReSharper C++ 2016.1 comes with quick-fixes to change variable type, function return type, type of unmatched out of class definition or declaration. Another new quick-fix lets you create a field from constructor parameter.
      Quick-fix to create field from constructor parameter
      We also added a set of new context actions and quick-fixes for working with #include directives; quick-fixes to change type of unmatched out-of-class function definition; to make a data member mutable or a member function non-const; to make a base class or a function non-final; to move all function definitions inside a selection.
    • The list of supported C++ language features is extended with generalized lambda captures, exception specifications, user defined literals and delegating constructors.
    • ReSharper C++ 2016.1 enhances Rename refactoring, which can now automatically rename corresponding files (both source and header) along with code symbols, and to update usages in include directives.
    • ReSharper C++ 2016.1 adds support for the Boost.Test framework to its Unit Test Runner. Please note that only Boost version 1.60 is supported.
      Boost.Test support in ReSharper C++
    • Code generation improvements. The Generate stream operations action available via Alt+Ins can now generate stubs for Boost.Serialization functions: save(), load() and serialize(). In addition, formatting options are now taken into account when generating code.
    • All ReSharper C++ actions are now banned from changing library headers.

    Other tools within the ReSharper Ultimate family have received their shares of improvement as well.

    dotCover

    • Test execution in Continuous Testing for MSTest and xUnit test becomes faster with dotCover 2016.1 thanks to pre-loading test runners.
    • Coverage filters are now supported in Continuous Testing.
    • Quick search results are now highlighted in the coverage tree.
    • We added a button to explore the stack trace of the selected test in Stack Trace Explorer:
      Improved Continuous Testing tool window
    • Another improvement applies to the relationship between dotCover console runner and TeamCity. TeamCity is now tuned to understand the output of the console runner and can highlight its errors and warnings in the build log.

    dotTrace

    • dotTrace 2016.1 adds its Threads diagram into Visual Studio. Now, the integrated Timeline Viewer gets exactly the same diagram, which you can use to select threads, time range, and of course, view thread activity and filtered time intervals.
    • Moreover, the Threads diagram in both standalone and Visual Studio viewers gets smart tooltips. Hold the mouse over a specific time point on the timeline and a tooltip containing current thread state, executed method, and other info will appear. Tooltips are context-sensitive. This means that if some filter is applied, the tooltip will contain additional data on the filtered event. For example, when the File I/O filter is selected, the tooltip additionally shows info about file operation, file name, and data size.
      Threads diagram in Visual Studio with smart tooltips

    dotMemory

    dotMemory 2016.1 adds browser-style Back and Forward buttons to navigate across different views in profiling results.
    Back and Forward navigation in dotMemory

    dotMemory Unit

    dotMemory Unit 2.2 gets a number of improvements:

    • Object selection queries now support open generic types, which is useful if you want to get all substitutions of your generic type.
    • The GetNewObjects, GetSurvivedObjects, and GetDeadObjects methods get overloads that accept query as a parameter. This allows to avoid one more GetObjects call and simplify assertions.
    • You can select objects by wildcards using the Like and NotLike queries on types, interfaces, and namespaces.
    • You can use three constants when specifying a directory for saving workspaces in the DotMemoryUnit attribute. The constants are written in angle brackets: <User>, <LocalAppData>, <CommonAppData> and stand for, correspondingly, %USERPROFILE%, %APPDATA%, and %LOCALAPPDATA% directories.
    • Improved performance of key queries: Type.Is, Interface.Is and Namespace.Like.
    • Tests that execute queries from child processes are now handled correctly.

    Improvements in dotMemory Unit 2.2

    dotPeek

    • dotPeek 2016.1 learns to handle extension methods as instance methods and automatically highlights usages of the symbol under the caret.
    • With dotPeek 2016.1 you can load NuGet packages and their dependencies from any online package source, or load packages listed in a packages.config file in your Visual Studio project.

    Licensing

    If you have an active license to ReSharper, ReSharper C++ or ReSharper Ultimate, we encourage you to start using 2016.1 straight away.

    As we have just recently switched to subscription licensing, some of you may still use older, pre-subscription licenses. If you are not sure whether your licenses are eligible to use with 2016.1, or if you need a formal quote or any other assistance, please get in touch with JetBrains sales anytime.


    Get ReSharper Ultimate 2016.1

    ReSharper Ultimate 2016.2 EAP: Builds 5 and 6

    $
    0
    0

    Another couple of ReSharper 2016.2 EAP builds has appeared since our last post. If you haven’t done it yet, it’s the right time to download and try out new features and fixes. In these builds, we have fixed a numbers of issues as we normally do, improved support for the recently released .NET Core 1.0 and ASP.NET Core 1.0, and below are descriptions of some new features.

    HTML analysis inside .cs, .js, and .ts files

    If you wanted to cut corners and define some constant piece of HTML right in a string literal, you could miss some errors there… but not any longer. In C#, JavaScript or TypeScript, you can now use the Make HTML here action to enjoy syntax highlighting, error detection and other HTML goodies right inside the string literal:

    Injecting HTML inside a string literal

    New decompiler features in ReSharper and dotPeek

    • The code that the IL Viewer displays becomes more readable: types, members, type parameters, local variables, etc. are highlighted with distinct colors; loops in your code can be distinguished by corresponding indents and comments:

      IL viewer with highlighting and formatted loops

    • The arsenal of visual dependency analysis tools (Type Dependency Diagram and Project Dependency Diagram) is now extended with the new Assembly Dependency Diagram. You can invoke it on selected assemblies in the Assembly Explorer and study how those and referenced assemblies are linked with each other:

      Hierarchy of assembly references

    ReSharper C++

    • The latest 2016.2 EAP build includes an important optimization of C++ code analysis. For example, this optimization makes indexing (first opening) of the Unreal engine project several times faster.
    • Auto-completion in C++ now also suggests symbols that are not included in the current file. Of course, the corresponding #include directives are added automatically:

      Import suggestions in C++ auto-completion

    • There is a new code inspection that warns you about missing include guards in your header files. As a quick-fix, it lets you automatically add #pragma once directive.
    • And there are also a couple of new code formatting options: a line break in a member initializer list, and a space between closing angle brackets in template arguments (for conformance with pre-C++11 compilers).

    You are welcome to download the latest 2016.2 EAP build. Should you come across any problems, please let us know in ReSharper, ReSharper C++ or dotPeek issue trackers.

    ReSharper Ultimate 2016.2 Release Candidate

    $
    0
    0

    Ladies and gentlemen, you can now download ReSharper Ultimate 2016.2 Release Candidate!

    All new features and improvements that we have revealed and blogged about in recent months are now in pre-final state.

    This includes things as exciting as textual search via Go to Text, structural navigation with Tab, and warnings in solution-wide analysis, as well as more mundane fixes, of which there are plenty.

    If you still have pressing issues with 2016.2 RC or if something that we assume fixed doesn’t actually solve your issues (btw, everyone who has been unhappy about Move to Folder behavior with TFS, we’re waiting for you to confirm a fix), this is probably your last chance to let us know via comments here, or better yet, via issues in respective product trackers: ReSharper, ReSharper C++, dotTrace, dotMemory, dotPeek or dotCover.


    ReSharper Ultimate 2016.2 is here!

    $
    0
    0

    We at JetBrains have just finalized an update to the ReSharper Ultimate family, and we welcome you to download ReSharper Ultimate 2016.2 RTM!
    ReSharper 2016.2 is released
    Read on for the main highlights of this release:

    ReSharper

    In addition to 750+ fixes, major highlights of ReSharper 2016.2 are the following:

    • Support for ASP.NET Core 1.0 and .NET Core 1.0 projects, which means that ReSharper now correctly resolves project references and provides its core set of features (code inspections, code completion, navigation, search and refactorings) in projects of this type. Please note that unit testing is not yet supported .NET Core projects. This is going to be addressed in upcoming updates.ASP.NET Core support
    • Structural navigation, a new feature informally referred to as “Make Tab Great Again”. You can now use Tab and Shift+Tab keys to quickly move the text selection to the next or previous code element without having to use the cursor keys, letting you quickly navigate to the next important piece of code you need to edit.
      Structural Navigation in ReSharper 2016.2
      Tab will certainly continue to handle template expansion, and will also indent (and Shift+Tab will outdent) when the text caret is placed at the start of a line. However, when the text caret is within a code element, Tab and Shift+Tab will start navigating and selecting the structure of your code. You can change this behavior in ReSharper options anytime.
    • Go to Text navigation (Ctrl+T,T,T) lets you quickly find and navigate to any text in source and textual files. This new feature uses trigram indexing to make text search blazingly fast. Similar to other navigation commands, if there are too many matching items you can hit + on the numeric keypad to explore results in the Find Results window.
      Go to Text command in ReSharper 2016.2
    • Warnings in solution-wide analysis help you constantly keep track of all warnings in your solution: both actual compiler warnings and ReSharper’s inspections with the Warning severity level. The status bar indicator can now stay orange while there are unresolved warnings. It is still up to you whether to enable the solution-wide analysis and whether to include warnings into it: just right-click the status bar indicator to configure everything to your liking.
      Warnings in solution-wide analysis
    • Marking references as used at runtime to exclude them from code cleanup performed by the Optimize References and Remove Unused References features.
    • New C# typing assistant features, such as auto-replacing MethodName(.) with MethodName()., and correcting mistyped @$ prefixes for verbatim string interpolations.

    • Rearrange code improvements. For example, it is now available in interpolated string inserts, and in expressions with 3 and more operands; Greedy brace feature now works for opening brace, braces of types and namespace declarations.
    • Reworked surround templates. If you need to surround a piece of code with a template, just select the code, and type in the name of a template you need: no extra shortcuts required. In other news, a single template can now be used for for creating code (as a live template) and for surrounding existing code (as a surround template).
      Surround templates in completion lists
    • A new refactoring to move members to another part of a class. You can also use the refactoring over a region to move all region members into a new file with a name inferred from the region name.
    • New quick-fixes and context actions that help simplify string interpolation inserts, revert the order of iteration in simple for loops, or fix awaiting of a void method by making it return Task. (By the way, existing quick-fixes that make methods async now suggest using Task instead of void.) In other news, you can now check all parameters of a method for null (or empty strings) with a single context action. You can even uncomment or even delete a comment via Alt+Enter. Context action to add guard clauses for all arguments at once
    • Assembly dependency diagram that visualizes how assemblies are interrelated via references.
    • HTML analysis inside string literals in .cs, .js, and .ts files, which can be enabled with the context action or with a comment /*language=html*/ ahead of a string literal. You can now use the Mark HTML here action to enjoy syntax highlighting, error detection and other HTML goodies right inside the string literal.
    • Regular expression assistance in string literals can now also be enabled with a comment /*language=regexp|jsregexp*/ before the string literal. Language injection with comments
    • JSON value helpers allow you to tell ReSharper to provide code completion or validation for your own JSON files. You can add a helper in the JSON Value Helpers options page, matching based on a filename mask and/or schema match. Custom JSON schema catalogs can also be added in JSON options. These can be either a file, or a URL, which will be downloaded in the background, and periodically updated. JSON value helpers
    • Support for the <inheritdoc/> tag in XML documentation comments, which is a good alternative to copying documentation from base types/members to derivatives.
    • C# formatter improvements: new options for indenting of parentheses and code inside them; for controlling spaces before and after ++ and -- operators as well as before and inside parenthesis of checked and default expressions.
    • Improved IL Viewer: types, members, type parameters, local variables, etc. are contextually highlighted; loops in your code can be distinguished by indents and comments. IL viewer with highlighting and formatted loops
    • String interpolation suggestions, quick-fixes and context actions are now available for VB.NET. Context actions to convert a string literal to an interpolated string, or insert an interpolated argument are here as well.Concatenation to interpolation in VB.NET
    • Improved CSS support: ReSharper’s code inspections, code completion, navigation, search and refactorings are now also available for CSS variables. In addition, several fixes for better spec handling are introduced. CSS variables support in ReSharper 2016.2
    • Extended TypeScript/JavaScript support including:
      • Generating code with code completion in TypeScript (ctorf/ctorp, overrides, lambdas).
      • Improved Find Usages and Rename for union and intersection types.
      • Full support of TypeScript 2.0.0 features, including this for functions, control flow aware type guards, path mappings, optional class members, the never type.
      • If you have an abstract class implementing an interface, you can now generate missing members abstract, using the Generate action (Alt+Insert) or a quick-fix.
      • Go to Declaration and Find Usages work correctly when dealing with type aliases.
    • The Process Explorer window (ReSharper | Windows | Process Explorer), which was previously only available in dotPeek, provides you with the list of currently running processes, allows exploring their modules and decompiling those that are .NET assemblies.
      Process Explorer window in ReSharper 2016.2

    ReSharper C++

    ReSharper C++ 2016.2 comes with 200+ fixes and a set of larger improvements:

    • Inline Variable Refactoring is now available in ReSharper C++.Inline Variable refactoring for cpp
    • Quick Documentation pop-up appears in ReSharper C++ 2016.2. It can display documentation from Doxygen comment blocks, and even if there is no Doxygen documentation for a symbol, it will display the symbol signature. Quick documentation popup in ReSharper C++
    • New code inspections and quick-fixes: There is a new code inspection that warns you about missing include guards in your header files. As a quick-fix, it lets you automatically add #pragma once directive. Another new inspection detects a missing default case in a switch statement with a corresponding fix to add it.
    • Warnings about usages of classes and functions marked with the [[deprecated]]/__declspec(deprecated) attribute. ReSharper showing highlight for deprecated C++ code
    • Improved C++14 support: variable templates and decltype(auto).
    • Support of the [[noreturn]]/__declspec(noreturn) attribute in control flow analysis.
    • New code style preferences for #include directives in generated code.
    • Code style for default pointer initializer. You can specify 0, nullptr or NULL as the preferred initializer in the options, and ReSharper C++ will use it in generated initializers.
    • Automatic completion in C++ can now suggest symbols that are not included in the current file. The corresponding #include directives are added automatically.Import suggestions in C++ auto-completion
    • You can now generate documentation comments for C++ declarators, classes and macro definitions with a context action. The comment stub can be customized by editing the ‘doc’ live template that ReSharper uses for generation.
    • When your caret is on one of the exit points of a function/loop/switch (return, throw etc.), ReSharper C++ will automatically highlight all other exit points.
    • New formatter settings for single-line functions and lambdas, blank lines around single line function definitions, line breaks before member initializer list, and space between closing angle brackets in template arguments (for conformance with pre-C++11 compilers).
    • The mock function generator now supports the Trompeloeil framework.
    • Completion, usage search and rename of symbols in Doxygen comments.
    • __RESHARPER__ macro that allows you to detect when ReSharper is parsing your source code and, if necessary, disable ReSharper’s preprocessor for some code.
    • Performance improvements in indexing and code analysis.

    Other ReSharper Ultimate tools have received their shares of improvement as well.

    dotCover

    • dotCover 2016.2 lets you exclude auto-properties from coverage analysis with Hide auto-properties option.
    • Filtering processes from console runner allows you reduce unnecessary overhead by excluding child processes that are irrelevant to the coverage analysis. To enable a process filter, use the /ProcessFilters parameter. For example, /ProcessFilters=+:prA;+prB will exclude all processes except prA and prB; /ProcessFilters=-:prC will exclude prC from the coverage.

    dotTrace

    Recursive call stacks can be deep and difficult to analyze. Previously, Timeline Viewer would show call stacks “as is”, i.e recursive calls were simply shown as they were called: one after another in the stack trace, which would lead to long scrolling. With dotTrace 2016.2 Timeline Viewer, you can easily fold such calls to streamline stack analysis.Recursive call stack in dotTrace Timeline Viewer 2016.2

    dotMemory

    dotMemory now allows you to compare memory snapshots stored in different workspaces: that is, collected in different profiling sessions. This can be useful to check how particular changes in code affect your application’s memory usage. All you need are two snapshots taken before and after making the changes.
    Cross-workspace snapshots comparison in dotMemory 2016.2
    For the full list of fixes in dotMemory 2016.2 please refer to release notes.

    dotPeek

    • With dotPeek 2016.2, the IL Viewer displays code in a more readable manner: types, members, type parameters and local variables are contextually highlighted; loops in your code can be distinguished by indents and comments.
    • dotPeek 2016.2 adds Assembly Dependency Diagram to the existing visual dependency analysis tools. You can invoke it on assemblies selected in the Assembly Explorer and explore how the assemblies are referencing each other. Assembly_Hierarchy

    Licensing

    If you have an active subscription for ReSharper, ReSharper C++ or ReSharper Ultimate, we encourage you to start using 2016.2 straight away.

    As we have just recently switched to subscription licensing, some of you may still use older, pre-subscription licenses. If you are not sure whether your licenses are eligible to use with 2016.2, or if you need a formal quote or any other assistance, please get in touch with JetBrains sales anytime.


    Get ReSharper Ultimate 2016.2

    ReSharper Ultimate 2016.2: video and code samples

    $
    0
    0

    We have released ReSharper Ultimate 2016.2 last week, which introduced a whole lot of updates across ReSharper, ReSharper C++ and dotPeek, as well as a bunch of fixes and improvements in dotTrace, dotCover, and dotMemory.

    In case you feel that reading a multi-screen list of what’s new is too daunting, our old friend Hadi Hariri has come up with an under-10-minutes summary video:

    In the video, Hadi uses a lot of code samples from a special repository that we maintain in order to illustrate changes in new ReSharper Ultimate versions in a very code-centric way.

    If you like to learn what’s new in the latest ReSharper by playing with code that exposes the recent improvements, go ahead and clone this repository, which you can navigate using ReSharper’s own To-do Explorer.

    ReSharper Ultimate 2016.2.1 is available

    ReSharper Ultimate 2016.2.2: bug fix to a bug fix

    $
    0
    0

    Sometimes, a bug fix release needs a bug fix of its own.

    That’s what happened to ReSharper this time: yesterday’s 2016.2.1 release introduced a bug whereby running Code Cleanup would incorrectly introduce access modifiers ahead of static constructors (RSRP-460771).

    If you’re affected by this bug, please download and install ReSharper Ultimate 2016.2.2, and apologies for making you update twice.

    Try again. Fail again. Fail better. 👈

    ReSharper Ultimate 2016.3 EAP 5

    $
    0
    0

    We have recently published yet another build of ReSharper 2016.3 EAP, and let’s now look what’s inside.

    ReSharper

    In mainline ReSharper, there is a number of fixed issues and some new features:

    Dynamic completion of package names

    In project configuration files (project.json, package.json, and bower.json), ReSharper can now suggest available package names based on your input:

    Dynamic completion of package names

    Language injections

    In the first build of 2016.3 EAP, we added support for CSS and JSON as embedded languages, and now we’re adding support for JavaScript. This means that ReSharper will be able to parse the contents of a string literal, and treat it like a JavaScript snippet – with syntax highlighting, code completion, inspections, quick-fixes and so on.

    As before, this can be enabled using a specially formatted comment – 

    //language=javascript
     – which means the marker and the injected language will be shared across the team. If you don’t wish to modify the file, you can also use Alt+Enter and the “Mark as” submenu, which stores a tracking marker in ReSharper’s caches, but mind that the marker is local to your machine only:

    Marking string literal as JavaScript

    ReSharper also automatically injects languages in certain known scenarios, such as injecting JavaScript into AngularJS templates, or CSS in jQuery’s 

    $[]
     indexer. For C# code, it will also automatically inject based on usage of the 
    HtmlElementAttributes
     and 
    HtmlAttributeValue
     annotation attributes.

    This build also includes a new options page for language injections, allowing you to selectively enable or disable built-in automatic injections:

    Automatic Language Injection options page

    ReSharper C++

    Among other fixes in ReSharper C++, this EAP build fixes the problem of user output from tests in Boost 1.62 and improves performance of the Boost.Test runner.

    dotMemory

    dotMemory now checks your application on finalized objects and objects queued for finalization. A new Finalizable objects inspection on the overview page shows such objects sorted by their type.

    dotMemory Finalizable Objects Inspection

    There are two problems in having finalized objects:

    • The finalization thread is run unpredictably, which, first, may cause problems in case you want to reclaim the unmanaged resources as quickly as possible, and, second, may lead to sudden performance drops.
    • The lifetime of finalizable objects is extended by at least one more garbage collection cycle (when garbage collector reaches such objects, it first promotes them to the next generation).

    Therefore, it is more effective to implement the

    IDisposable
    interface for these objects. In this case, you reduce objects’ lifetime and explicitly run all disposal routines via the
    Dispose()
    method.

    dotPeek

    dotPeek introduces new ways to explore metadata of .NET assemblies – in addition to displaying and searching for metadata tokens, you can now dig through all metadata items (tables, blobs, strings, etc.) in the Metadata node that appears under each assembly. Noticeable features of this node include:

    • Automatically finding and displaying usages of metadata table items.
    • Decoding and displaying values of blob items.
    • On double-click, decompiling and displaying code that corresponds to the metadata item.
    • Exploring PE file headers.

    Metadata tree in dotPeek

    Download

    If you haven’t done so yet, please download the latest 2016.3 EAP build and give it a try. As usual, we welcome your feedback via issue trackers of the corresponding products: ReSharper, ReSharper C++, dotMemory, and dotPeek.

    Viewing all 221 articles
    Browse latest View live